Try the sheet here, on the example
The sheet is open below with sample numbers. Change any white cell and watch the results update, or press the blank-copy button to type your own data from scratch. Nothing you type leaves your browser.
Example from the sheet
| الحملة | المنصة | الهدف | حصة الميزانية % | الميزانية (جنيه) | التحويلات | الإيراد (جنيه) | ROAS | الربح بعد الإعلان | الحالة |
|---|---|---|---|---|---|---|---|---|---|
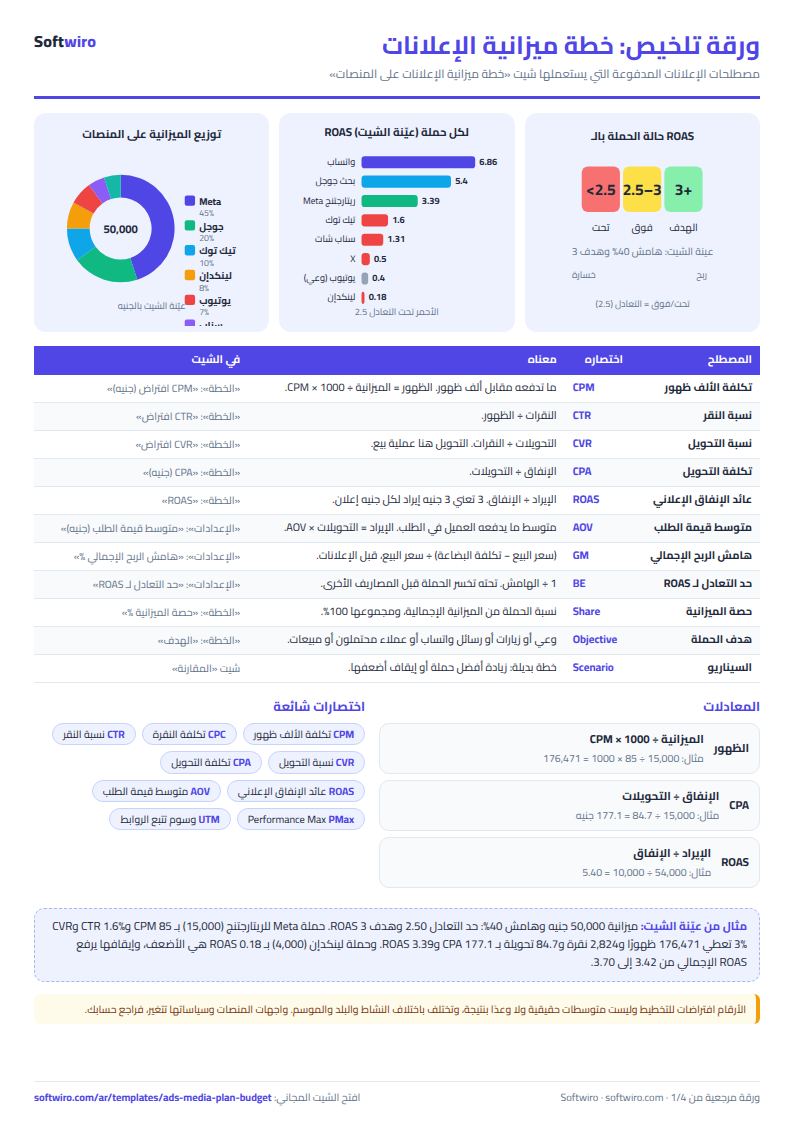
| مبيعات المتجر - ريتارجتنج | Meta (فيسبوك وإنستجرام) | مبيعات | 30.0% | 15,000.00 | 84.7 | 50,823.53 | 3.39 | 5,329.41 | يحقق الهدف |
| رسائل واتساب - عروض الموسم | Meta (فيسبوك وإنستجرام) | رسائل واتساب | 15.0% | 7,500.00 | 85.7 | 51,428.57 | 6.86 | 13,071.43 | يحقق الهدف |
| بحث جوجل - كلمات الشراء | Google Ads | مبيعات | 20.0% | 10,000.00 | 90.0 | 54,000.00 | 5.40 | 11,600.00 | يحقق الهدف |
| تيك توك - فيديو المنتجات | تيك توك | زيارات | 10.0% | 5,000.00 | 13.3 | 8,000.00 | 1.60 | -1,800.00 | تحت التعادل |
| سناب شات - عروض الويك إند | سناب شات | مبيعات | 5.0% | 2,500.00 | 5.5 | 3,272.73 | 1.31 | -1,190.91 | تحت التعادل |
| لينكدإن - عملاء الشركات | لينكدإن | عملاء محتملون | 8.0% | 4,000.00 | 1.2 | 720.00 | 0.18 | -3,712.00 | تحت التعادل |
| يوتيوب - تعريف بالعلامة | يوتيوب | وعي | 7.0% | 3,500.00 | 2.3 | 1,400.00 | 0.40 | -2,940.00 | وعي: لا يُقاس بالعائد |
| X - إعلانات الترند | X (تويتر) | زيارات | 5.0% | 2,500.00 | 2.1 | 1,250.00 | 0.50 | -2,000.00 | تحت التعادل |
| الإجمالي | 100.0% | 50,000.00 | 284.8 | 170,894.83 | 3.42 | 18,357.93 | يحقق الهدف |
Example from the “الخطة” tab (Arabic), with the numbers and formulas that are in the file.
What is inside
- «الإعدادات» (Settings): Business name, month, total budget (EGP), average order value, gross profit margin and target ROAS. The sheet calculates the break-even ROAS = 1 / margin.
- «الخطة» (Plan): Up to 12 campaigns. For each: platform and objective from the list, its share of the budget, and the CPM, CTR and CVR assumptions. For each campaign it calculates budget, impressions, clicks, conversions, CPA, revenue, ROAS, profit after ad spend and status, with a total row and an alert if the shares do not add up to 100%.
- «المقارنة» (Comparison): You set the percentage increase for the best campaign and the percentage cut for the weakest, and the sheet shows spend, conversions, revenue, ROAS, CPA and profit for the three scenarios and the difference between them, with a detailed table for each campaign.
The file opens on a start tab (“ابدأ هنا”, Start here) that explains how to use it.
What makes it different
Put the numbers in one place before you spend: what each campaign is expected to deliver, which platform is below break-even, and what changes if you move part of the budget. You make the allocation decision from a written calculation instead of guessing, and replace the assumptions with actual performance numbers when the month ends.
How to use it
- In the «الإعدادات» (Settings) sheet, enter the business name, month, total budget, average order value, gross profit margin and target ROAS.
- In the «الخطة» (Plan) sheet, enter each campaign in a row (up to 12): choose the platform and objective from the list, then its share of the budget.
- Enter your assumptions for each campaign: cost per thousand impressions (CPM), click-through rate (CTR) and conversion rate (CVR). Start with the numbers from your past campaigns in each platform's dashboard.
- Check the total and the shares alert: the shares must add up to 100%. The sheet calculates budget, impressions, clicks, conversions, CPA, revenue, ROAS, profit and the status of each campaign.
- Open the «المقارنة» (Comparison) sheet and set the percentage increase for the best platform and the percentage cut for the weakest, to compare spend, revenue and profit across the three scenarios.
- When the month ends, replace the assumptions with actual performance numbers from the platforms and re-run the estimate for the next month.
Before you start:
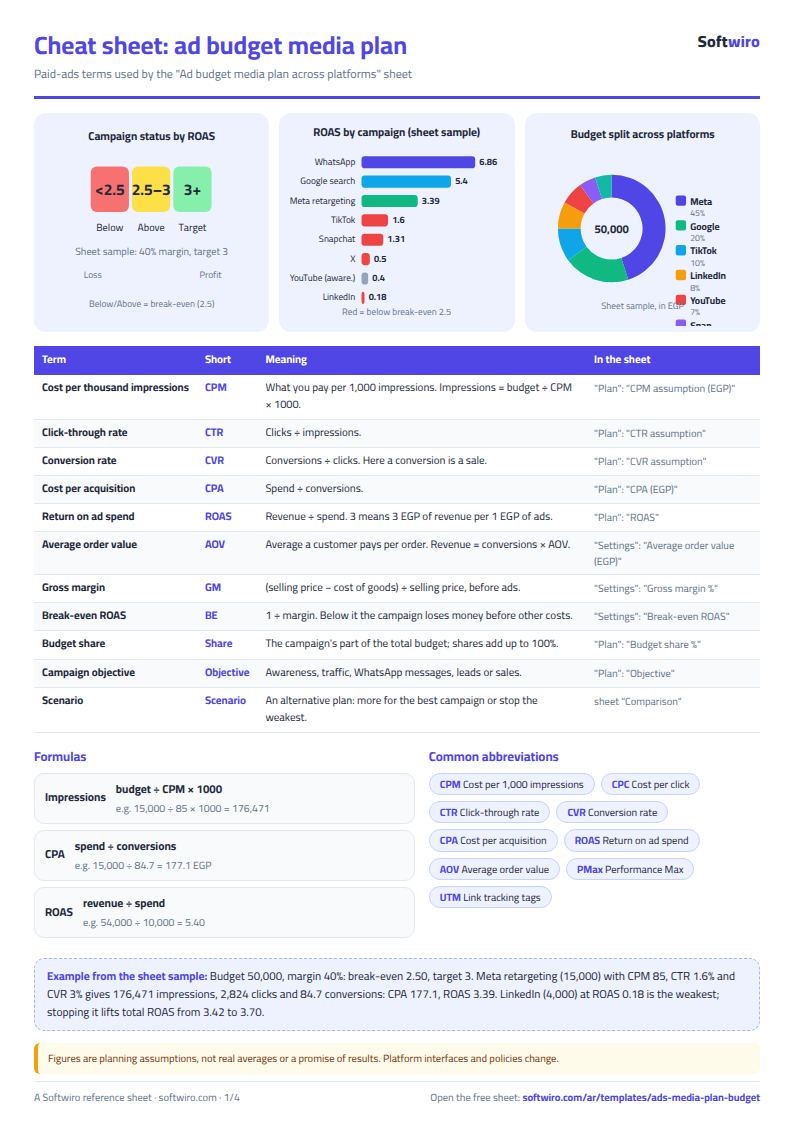
- The metrics: CTR = clicks / impressions, CPC = spend / clicks, CPM = spend / impressions x 1000, CVR = conversions / clicks, CPA = spend / conversions, ROAS = revenue / spend.
- All the CPM, CTR and CVR figures in the sample are illustrative assumptions you can edit, not real averages for any platform; your own campaign numbers are the basis.
- A conversion here means a sale, and revenue = conversions x average order value. For messaging and lead campaigns, enter in CVR the rate at which a message or lead turns into an actual sale.
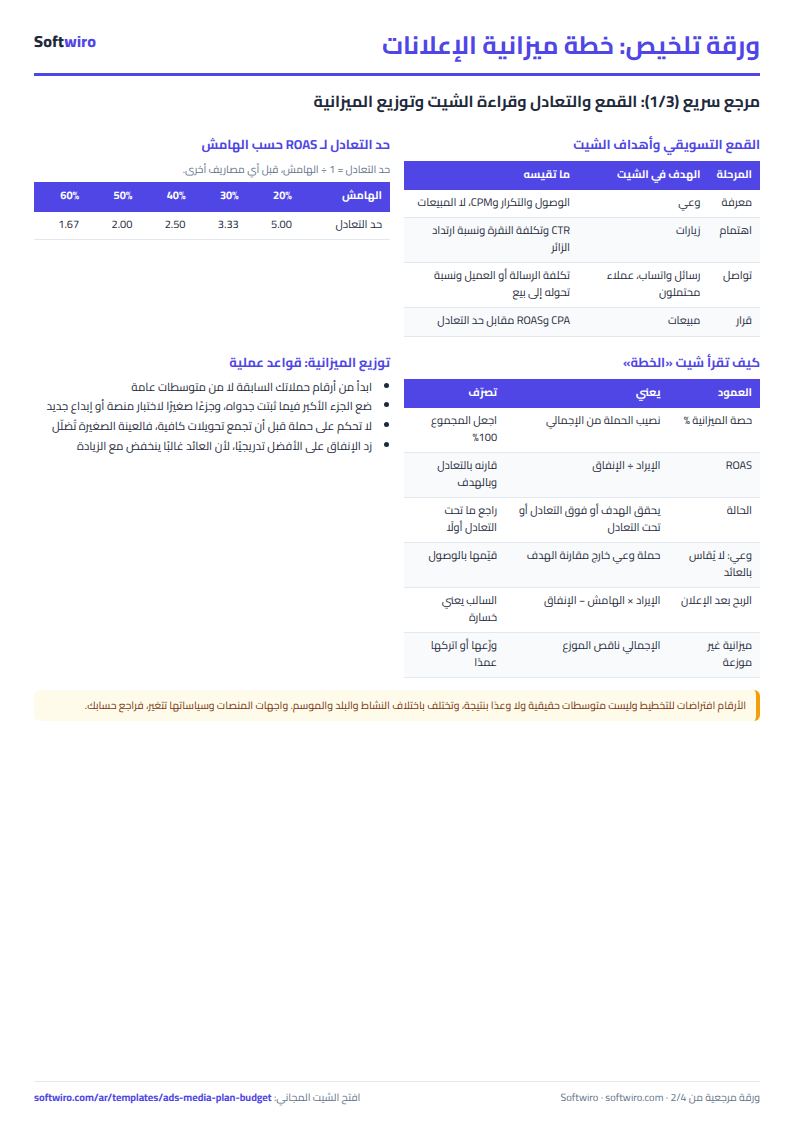
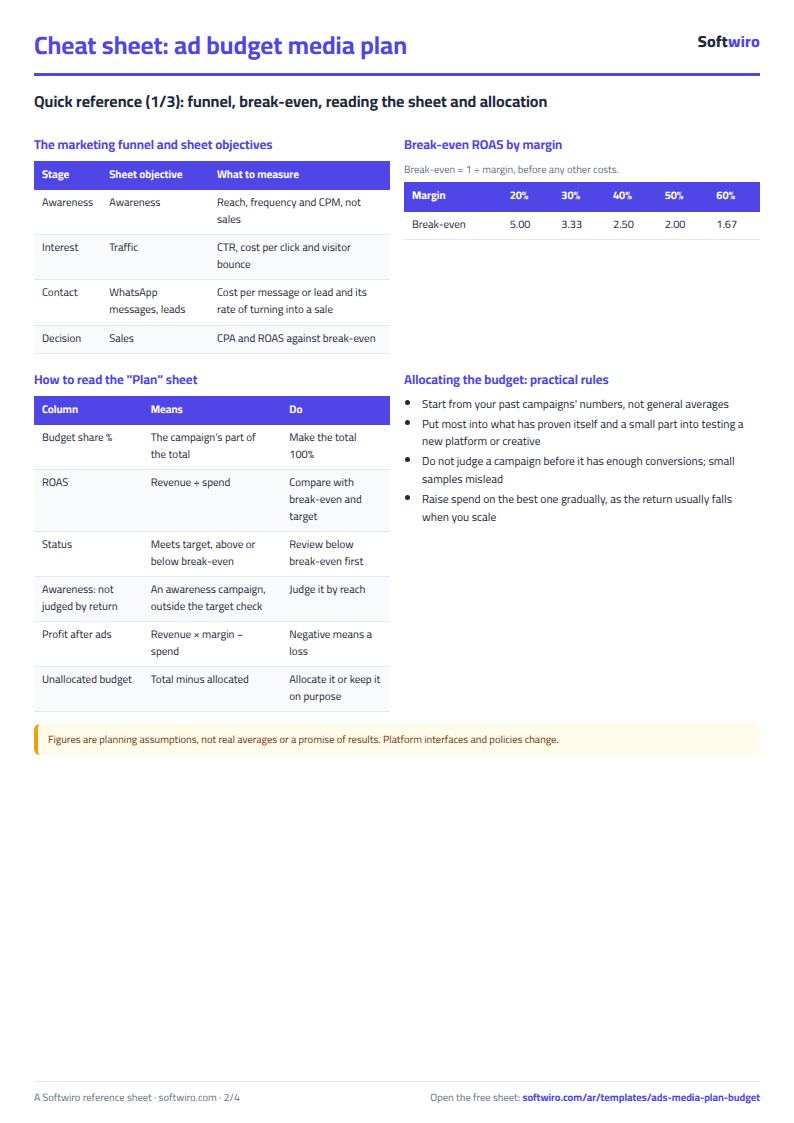
- Profit after ads = revenue x gross profit margin - ad spend. Break-even ROAS = 1 / margin, and any campaign below it loses money before other expenses.
- Awareness campaigns are judged by reach and frequency, not direct sales, so their status is "awareness" and they are not compared with the ROAS target, but they are included in the totals.
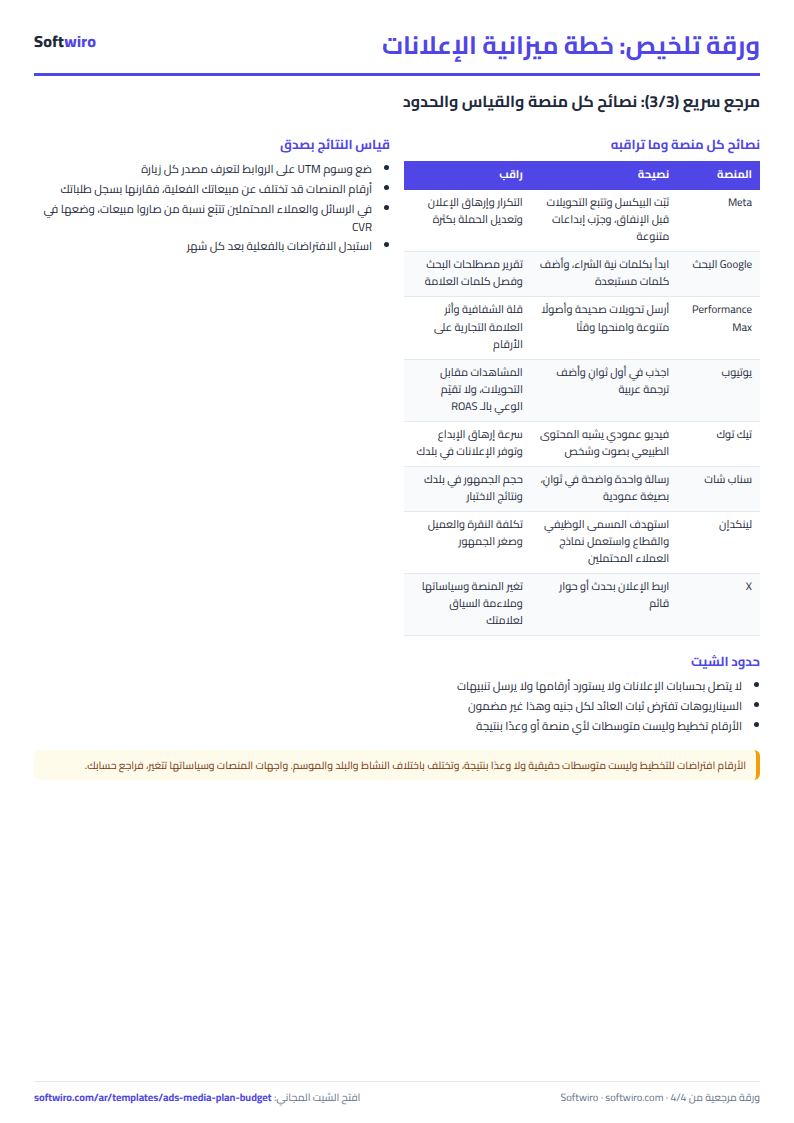
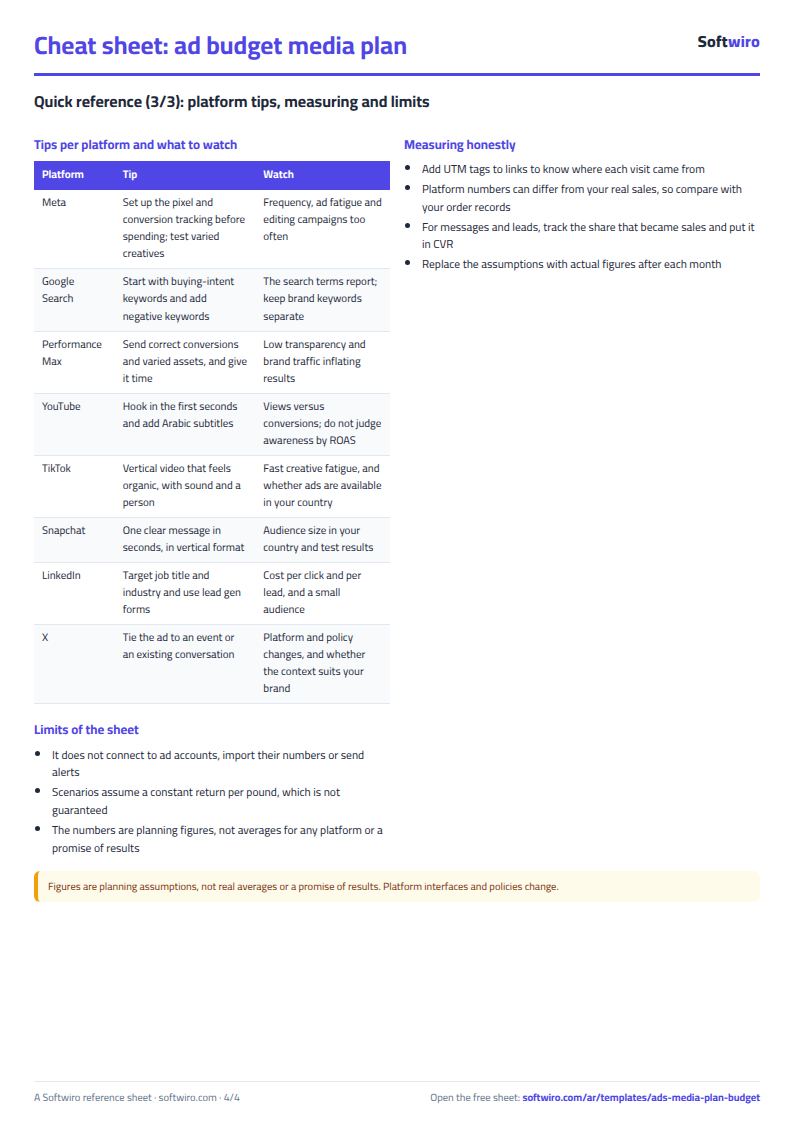
- The comparison scenarios assume the return on each pound is constant, which is not guaranteed: increasing spend on a platform often raises cost and lowers return. It is a planning estimate, not a promise of a result.
Free cheat sheet for this field
Terms, abbreviations, tables and diagrams over several pages, in Arabic and English. Download it as a PDF or images, including a phone-size version.
Still running this on Excel?
This sheet suits a start and a limited amount of data. If your way of working grows, or you need more than one person working on it at the same time, Softwiro can build you a program that fits the way you work.
| In this sheet | In Custom Software from Softwiro |
|---|---|
| One file that one person edits at a time, and copies reach you on WhatsApp. | A program with a login for each user and permissions you define, and everyone sees the same data. |
| You type everything and check the numbers by hand. | We design the screens around your work steps, so each person records only what concerns them. |
| Columns and formulas are fixed as the sheet was designed. | We build what you need: reports, alerts and screens your way. |
| Backups and security are your own responsibility. | The program runs on a secured server with regular backups. |
Frequently asked questions
How do I split an ad budget across platforms in Excel?
In the «الخطة» (Plan) sheet, enter each campaign in a row, choose the platform and objective, and enter its share as a percentage of the total budget in «الإعدادات» (Settings). The sheet calculates each campaign's budget in EGP and alerts you if the shares do not add up to 100%. Start with a split based on the numbers from your past campaigns, then adjust it once you see actual performance.
What is break-even ROAS and how does the sheet calculate it?
Break-even = 1 / gross profit margin. With a 40% margin the limit is 2.50, meaning every pound of ads must bring back at least 2.50 pounds of revenue to cover itself before other expenses. A campaign below this limit shows "below break-even", and one above the target ROAS you entered shows "meets target".
Are the CPM, CTR and CVR numbers in the sheet real platform averages?
No. They are illustrative assumptions that you can edit, not averages for any platform, and real numbers vary by business, country, creative and season. Start with the numbers from your past campaigns in each platform's dashboard, and replace them with actual numbers every month.
Does the sheet guarantee that raising the budget on the best platform increases profit?
No. The «المقارنة» (Comparison) scenarios assume the return on each pound stays constant, but increasing spend on a platform often raises the cost of reach and lowers the return. Treat the difference as a planning estimate, increase gradually and watch the results.
Is the template free?
Yes, with no sign-up and no email address. Use it, edit it and share it as you like.
Does it work in Google Sheets and on mobile?
The sheet uses formulas supported by Excel 2016 and later, Google Sheets and LibreOffice, so you can upload it to Google Drive and open it with Google Sheets on a computer or a phone.
What is the difference between the white and the gray cells?
You type in the white cells; the gray cells are calculated automatically. Don't type in a gray cell, or you will erase its formula.
Can I use the sheet from an AI assistant?
Yes. Add our MCP server (URL https://softwiro.com/api/mcp, no key needed) to your assistant and ask it to do the calculation in this template. The numbers come from the sheet's own formulas, and we do not store your data. The steps and a ready-made prompt are in this article: https://softwiro.com/blog/mcp-excel-templates-ai-agent-guide.html
All the templates in this group: Excel templates for paid ads: budget, performance and reports
More free templates for: Marketing and advertising
More free templates
- Ad campaign performance tracker
- Ads A/B test log
- Ads break-even and unit economics sheet
- Ad agency client management and reports
- UTM link builder and campaign naming
- Ad account audit checklist
- Ads creative production calendar
- Ads lead quality tracker
- Media buyer rules sheet: ad formulas, scaling rules and testing discipline
- Cash flow forecast sheet
- Annual budget by department: plan vs actual
- Project budget vs actual sheet
- Simple daily expense sheet (phone-first)
- Multi-warehouse and branch inventory sheet with transfers
- Periodic stock count and count-difference reconciliation sheet
- Restaurant and cafe inventory and waste sheet
- Spare parts inventory sheet