Try the sheet here, on the example
The sheet is open below with sample numbers. Change any white cell and watch the results update, or press the blank-copy button to type your own data from scratch. Nothing you type leaves your browser.
Example from the sheet
| المنتج | حقيبة جلد نسائية |
|---|---|
| المنصة | Meta |
| ميزانية الإعلانات الشهرية (ج.م) | 30,000.00 |
| تكلفة النقرة CPC المتوقعة (ج.م) - افتراض | 3.50 |
| معدل التحويل CVR المتوقع - افتراض | 2.0% |
| CPA مباشر بدل CPC÷CVR (اختياري) | |
| متوسط طلبات إعادة الشراء لكل عميل - افتراض | 0.30 |
| حصة المنتج من التكاليف الثابتة | 100.0% |
| النتيجة | |
| رقم المنتج في القائمة | 1 |
| سعر البيع | 750.00 |
| هامش المساهمة للطلب | 342.10 |
| ROAS التعادل | 2.19 |
| أقصى CPA | 342.10 |
| CPA المستخدم (= CPC ÷ CVR أو المباشر) | 175.00 |
| الطلبات المتوقعة في الشهر | 171.4 |
| النقرات المتوقعة | 8,571 |
| إيراد الطلبات قبل المرتجعات | 128,571.43 |
| صافي الإيراد بعد المرتجعات | 113,142.86 |
| ROAS المتوقع = الإيراد ÷ الإنفاق | 4.29 |
| إجمالي هامش المساهمة | 58,645.71 |
| التكاليف الثابتة المحمّلة على المنتج | 28,000.00 |
| صافي الربح بعد الإعلانات والتكاليف الثابتة | 645.71 |
| الطلبات اللازمة للتعادل (إعلانات + ثابتة) | 169.5 |
| الفرق عن طلبات التعادل | 1.9 |
| تقييم CPA | CPA ضمن الحد الأقصى |
| قيمة العميل LTV = الهامش × (1 + إعادة الشراء) | 444.73 |
| نسبة LTV إلى CAC | 2.54 |
Example from the “المحاكاة” tab (Arabic), with the numbers and formulas that are in the file.
What is inside
- الإعدادات (Settings): Your business name, target profit margin, monthly fixed costs (5 items), and your product table (up to 10) with selling price, cost of goods, shipping, payment fee and return rate.
- المنتجات (Products): For each product: net revenue after returns, contribution margin per order and its percentage, break-even ROAS, maximum CPA, target CPA and target ROAS, and a product status: "can afford ads", "misses target margin" or "loss before ads".
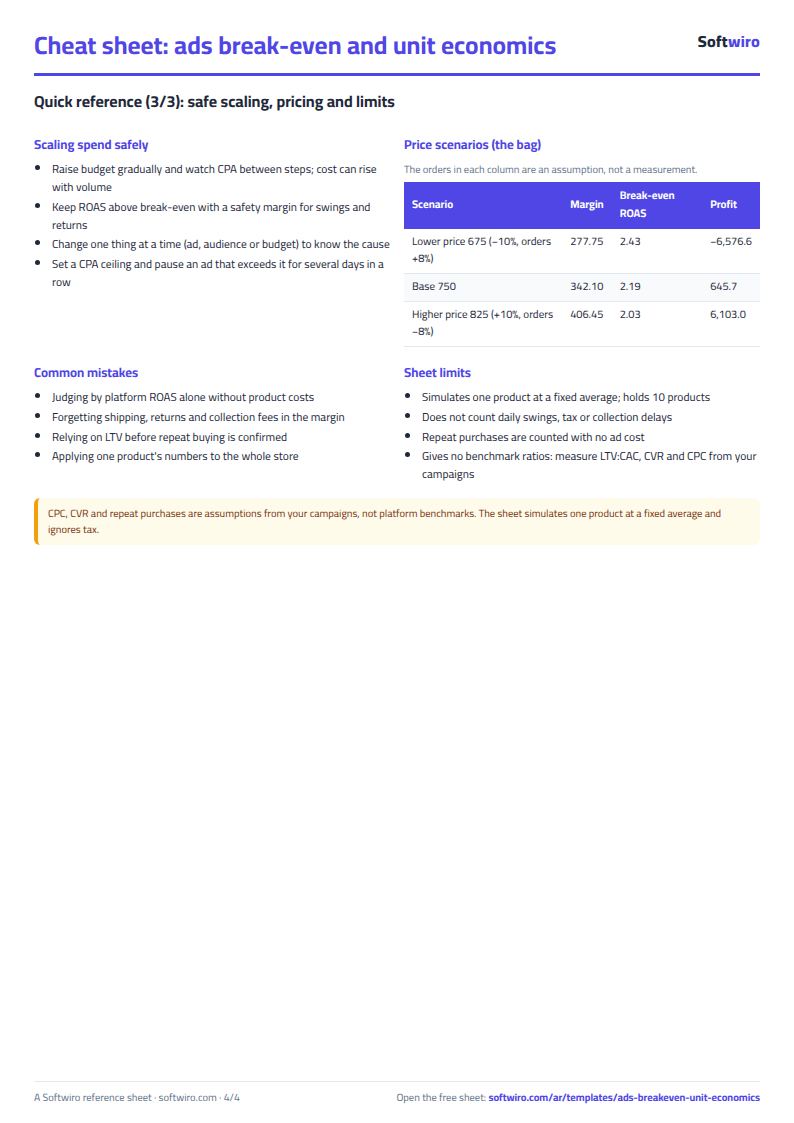
- المحاكاة (Simulation): Choose the product and platform and enter the budget, cost per click and conversion rate (or CPA directly) and repeat purchases. It shows orders, clicks, expected ROAS, profit after ads and fixed costs, break-even orders, a CPA rating, LTV and the LTV to CAC ratio, with three price scenarios below.
The file opens on a start tab (“ابدأ هنا”, Start here) that explains how to use it.
What makes it different
Before you spend a pound on ads you know which product can afford them, the most you can pay per order, and how shipping, returns and payment fees affect your margin. You no longer judge by the platform's ROAS alone.
How to use it
- In the "الإعدادات" (Settings) sheet, enter your business name, target profit margin and monthly fixed costs (rent, salaries and tools).
- Enter your products (up to 10) in the table: selling price, cost of goods, shipping, payment or cash-on-delivery fee percentage and return rate.
- Open the "المنتجات" (Products) sheet to see, for each product, the contribution margin per order, break-even ROAS, maximum CPA, target CPA and product status.
- In the "المحاكاة" (Simulation) sheet, choose the product and platform and enter the month's budget, cost per click and conversion rate (or CPA directly), and the expected number of repeat purchases.
- Read the result: expected orders, profit after ads and fixed costs, orders needed to break even, and the LTV to CAC ratio.
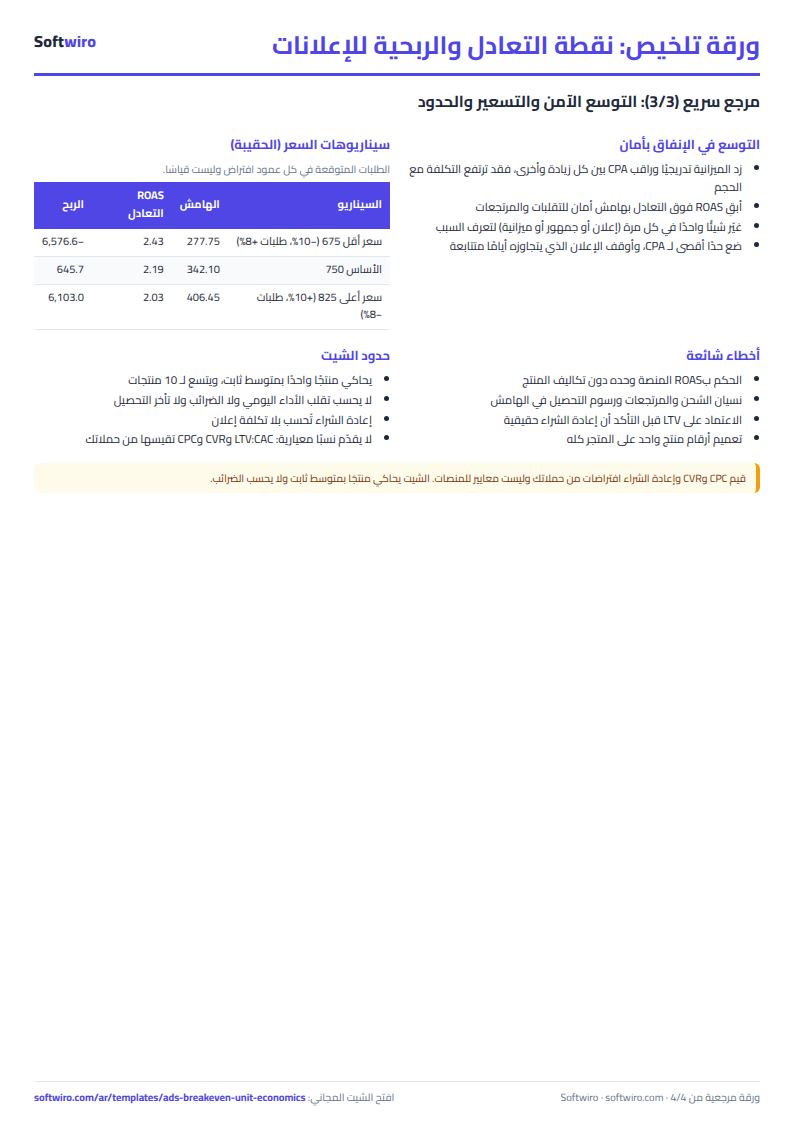
- Change the price change and order change percentages at the bottom of the simulation to compare a lower-price and a higher-price scenario with the base case.
Before you start:
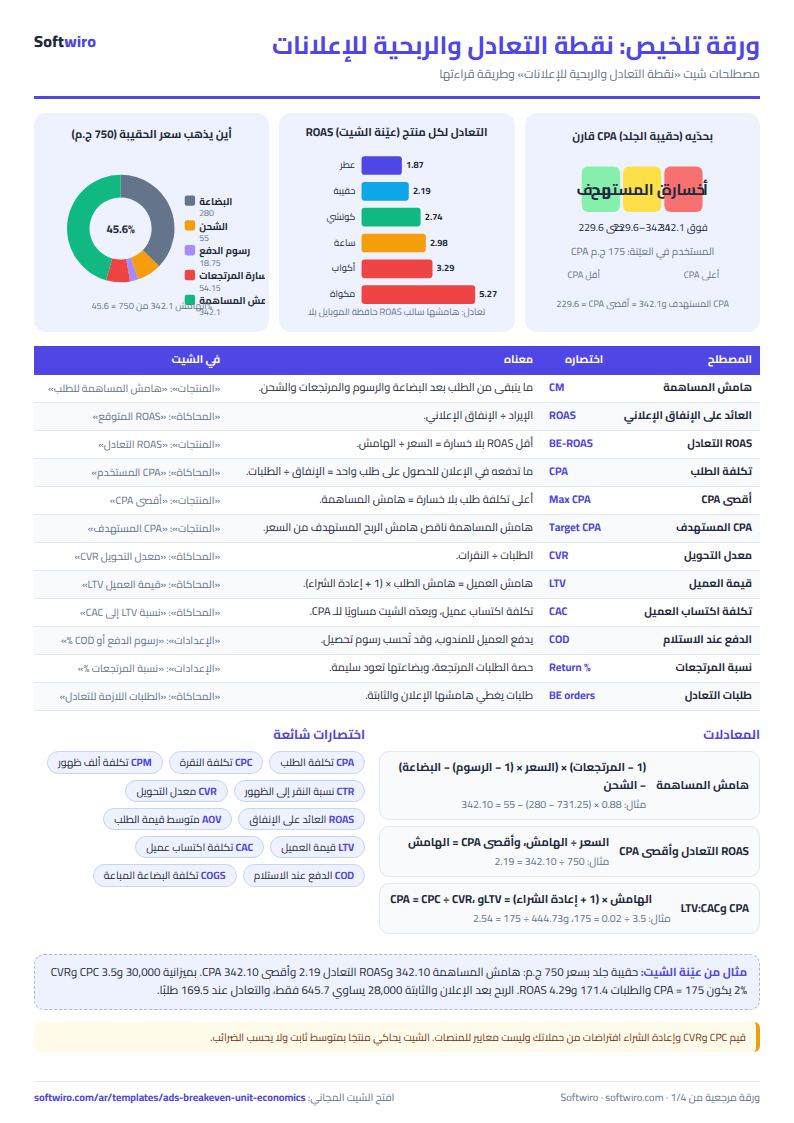
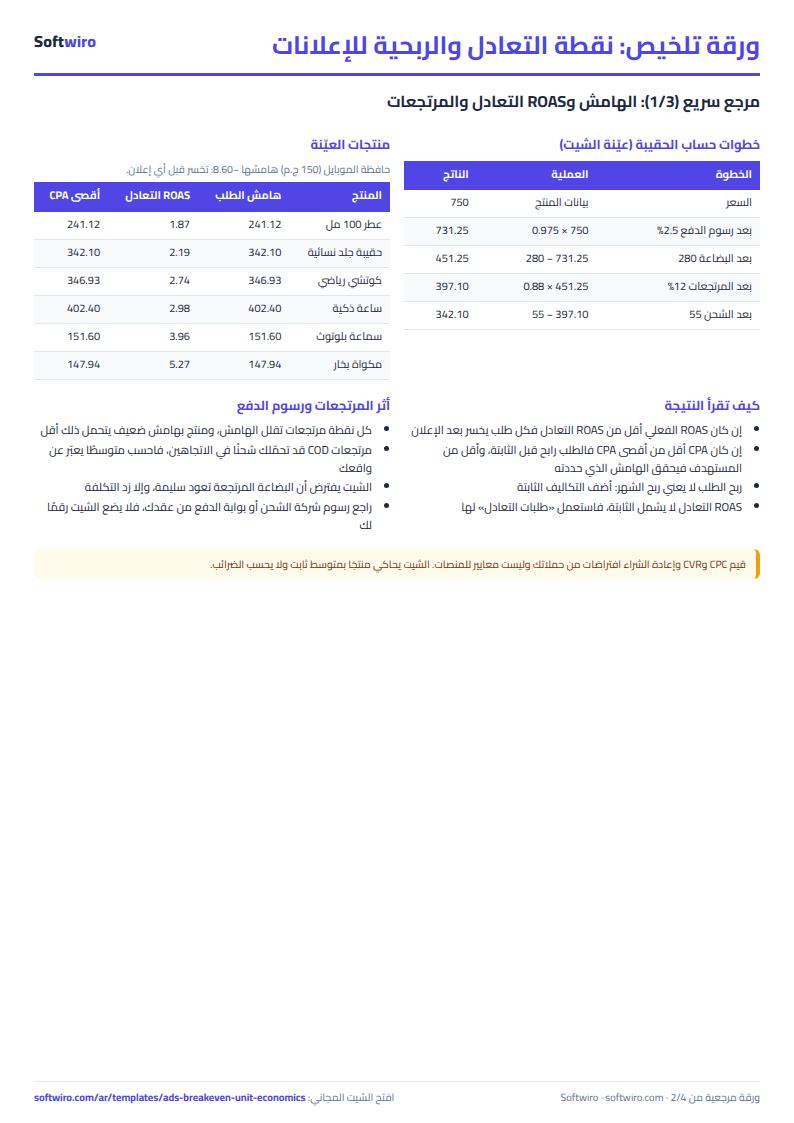
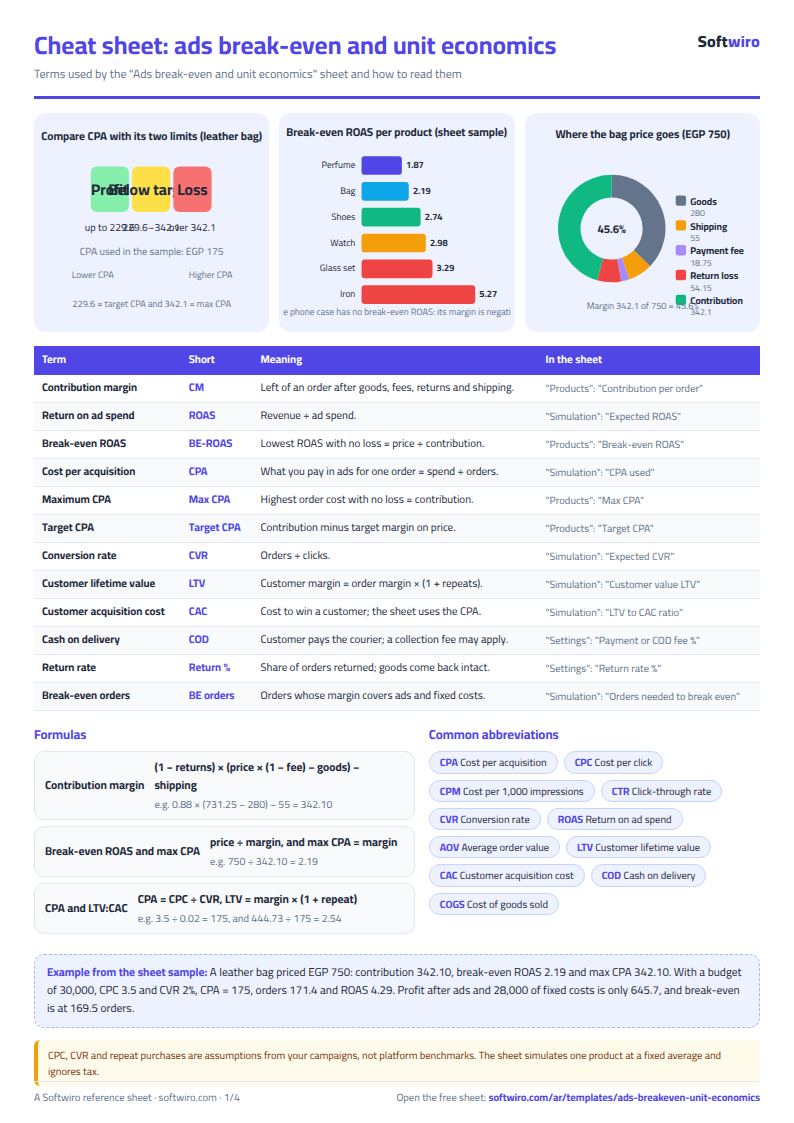
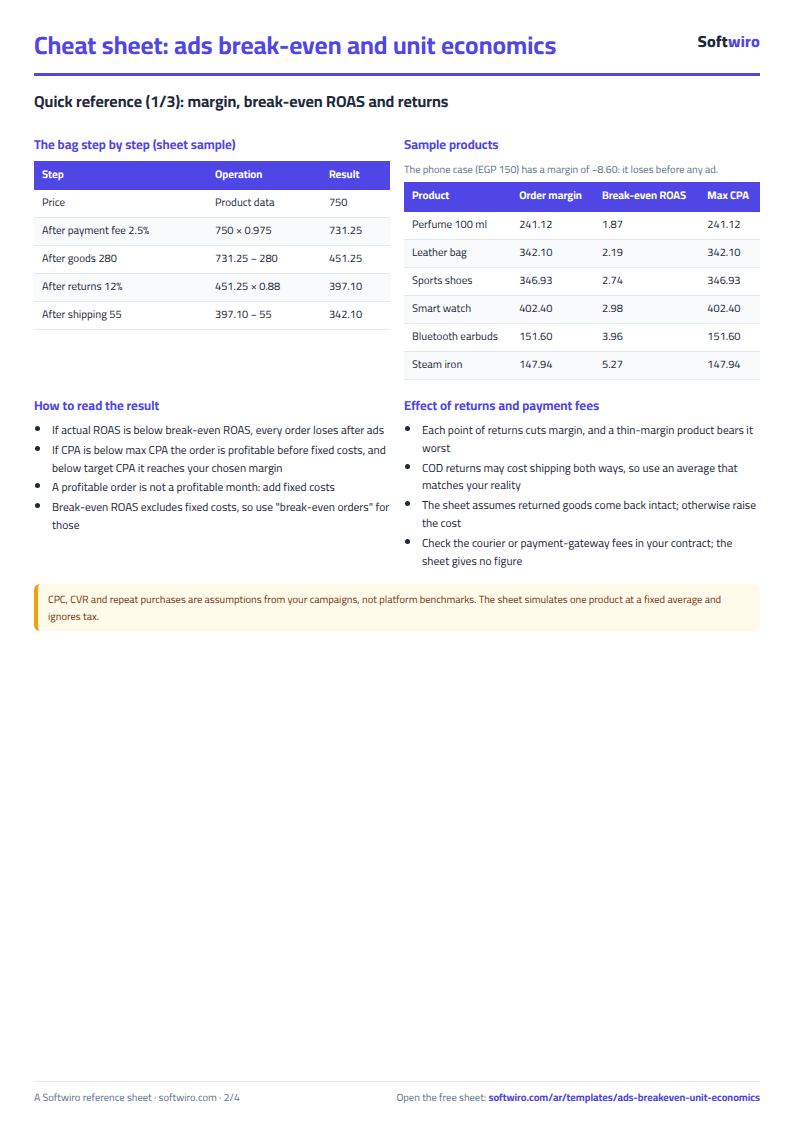
- Contribution margin per order = (1 − returns) × (price × (1 − payment fee) − cost of goods) − shipping. We assume shipping is paid on every order and that returned goods come back to stock undamaged.
- Break-even ROAS = selling price ÷ contribution margin, maximum CPA = contribution margin, and target CPA = contribution margin − (price × target profit margin).
- The metrics are standard: CPC = spend ÷ clicks, CVR = orders ÷ clicks, CPA = spend ÷ orders = CPC ÷ CVR, and ROAS = revenue ÷ spend.
- Cost per click, conversion rate, repeat purchases and how orders change with price are all assumptions you set from your own campaigns. They are not platform benchmarks. The values in the sheet are editable examples.
- Limits: the sheet simulates one product at a time at a fixed average, loads it with its share of fixed costs, and does not account for day-to-day swings in performance, delayed collection or taxes. It holds 10 products.
- Repeat purchases are counted with no ad cost, so check the figure against your actual data before relying on LTV.
Free cheat sheet for this field
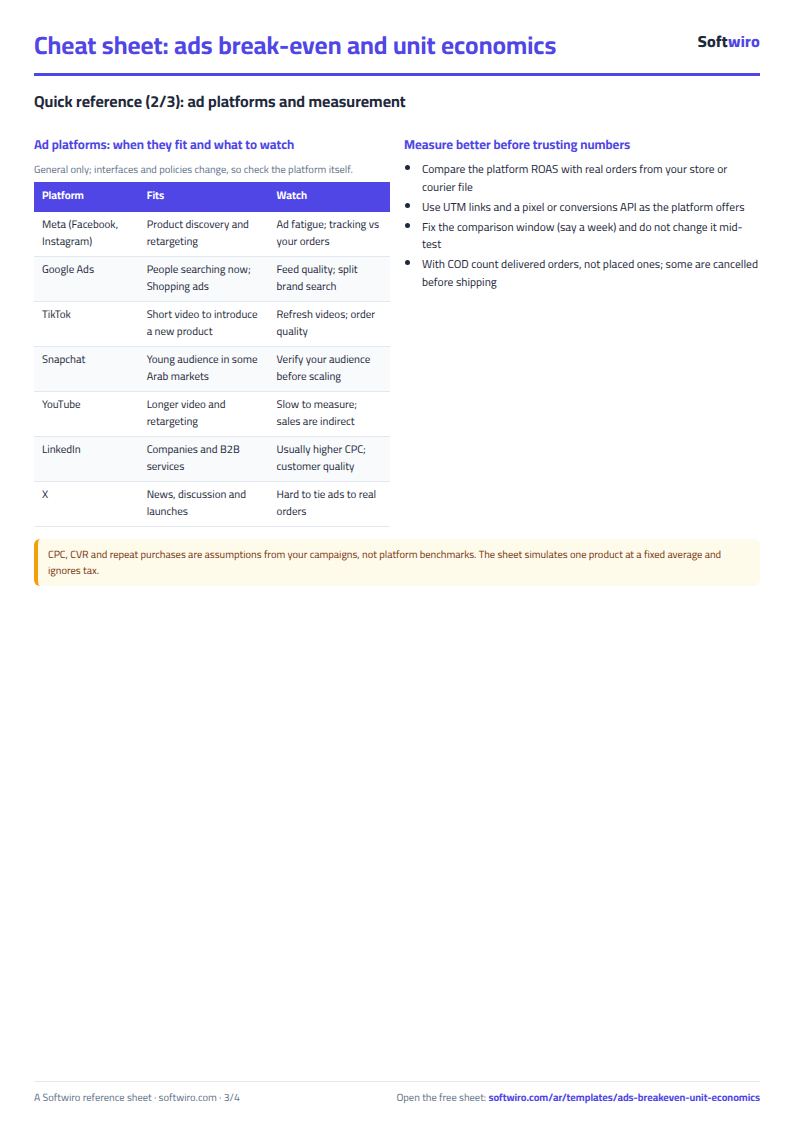
Terms, abbreviations, tables and diagrams over several pages, in Arabic and English. Download it as a PDF or images, including a phone-size version.

Still running this on Excel?
This sheet suits a start and a limited amount of data. If your way of working grows, or you need more than one person working on it at the same time, Softwiro can build you a program that fits the way you work.
| In this sheet | In Custom Software from Softwiro |
|---|---|
| One file that one person edits at a time, and copies reach you on WhatsApp. | A program with a login for each user and permissions you define, and everyone sees the same data. |
| You type everything and check the numbers by hand. | We design the screens around your work steps, so each person records only what concerns them. |
| Columns and formulas are fixed as the sheet was designed. | We build what you need: reports, alerts and screens your way. |
| Backups and security are your own responsibility. | The program runs on a secured server with regular backups. |
Frequently asked questions
How do I calculate break-even ROAS in Excel?
Break-even ROAS = selling price ÷ contribution margin per order, where contribution margin = (1 − returns) × (price × (1 − payment fee) − cost of goods) − shipping. For example, a bag priced at 750 with a margin of 342.10 has a break-even ROAS of 750 ÷ 342.10 = 2.19. Below that, you lose money on every order after ad cost.
What is maximum CPA, and how is it different from target CPA?
Maximum CPA is the contribution margin itself: the most you can pay per order without a loss before fixed costs. Target CPA is the margin minus (price × target profit margin), which is what you can pay if you want to keep a set percentage of the price as profit.
Should I rely on the cost per click and conversion rate in the sheet?
No. They are example numbers that you replace with your real campaign numbers. They are not platform benchmarks, and they vary by product, platform and season. The sheet also simulates a product at a fixed average, so it does not capture day-to-day swings in performance.
How do I read the LTV to CAC ratio here?
LTV = margin per order × (1 + average repeat purchases), and the sheet treats CAC as equal to CPA. In the sample, 444.73 ÷ 175 = 2.54. Repeat purchases are counted with no ad cost, so check that figure against your own data before relying on the ratio. The sheet does not give you a ready-made "good" ratio.
Is the template free?
Yes, with no sign-up and no email address. Use it, edit it and share it as you like.
Does it work in Google Sheets and on mobile?
The sheet uses formulas supported by Excel 2016 and later, Google Sheets and LibreOffice, so you can upload it to Google Drive and open it with Google Sheets on a computer or a phone.
What is the difference between the white and the gray cells?
You type in the white cells; the gray cells are calculated automatically. Don't type in a gray cell, or you will erase its formula.
Can I use the sheet from an AI assistant?
Yes. Add our MCP server (URL https://softwiro.com/api/mcp, no key needed) to your assistant and ask it to do the calculation in this template. The numbers come from the sheet's own formulas, and we do not store your data. The steps and a ready-made prompt are in this article: https://softwiro.com/blog/mcp-excel-templates-ai-agent-guide.html
All the templates in this group: Excel templates for paid ads: budget, performance and reports
More free templates for: Marketing and advertising
More free templates
- Ad budget media plan across platforms
- Ad campaign performance tracker
- Ads A/B test log
- Ad agency client management and reports
- UTM link builder and campaign naming
- Ad account audit checklist
- Ads creative production calendar
- Ads lead quality tracker
- Media buyer rules sheet: ad formulas, scaling rules and testing discipline
- Cash flow forecast sheet
- Annual budget by department: plan vs actual
- Project budget vs actual sheet
- Simple daily expense sheet (phone-first)
- Multi-warehouse and branch inventory sheet with transfers
- Periodic stock count and count-difference reconciliation sheet
- Restaurant and cafe inventory and waste sheet
- Spare parts inventory sheet