Try the sheet here, on the example
The sheet is open below with sample numbers. Change any white cell and watch the results update, or press the blank-copy button to type your own data from scratch. Nothing you type leaves your browser.
Example from the sheet
| مستوى الثقة المستخدم (%) | 95 |
|---|---|
| حد z | 1.960 |
| اختبارات مسجلة | 14 |
| B أفضل بثقة | 3 |
| A أفضل بثقة | 1 |
| لا فرق واضح بعد | 6 |
| بيانات قليلة | 4 |
| نسبة نجاح النسخ الجديدة (B أفضل ÷ كل الاختبارات) | 21.4% |
| نسبة نجاح B بين الاختبارات الحاسمة فقط | 75.0% |
| متوسط تحسّن CVR في اختبارات B الفائزة | 49.2% |
Example from the “الملخص” tab (Arabic), with the numbers and formulas that are in the file.
What is inside
- الإعدادات (Settings): Business name, confidence level (90, 95 or 99) and the matching z threshold, the minimum conversions per version (30 to start, and you can change it), and the lists of test types (6) and platforms (7).
- الاختبارات (Tests): One row per test: name, platform, test type, start and end dates, then impressions, clicks and conversions for version A and version B. It calculates CTR and CVR for each version, the relative difference, the pooled rate, z, the verdict and an alert for numbers that do not add up. It holds 200 tests.
- الملخص (Summary): The number of tests and how many ended as B better with confidence, A better with confidence, no clear difference or too little data, the win rate of new versions and the average improvement of the winners, plus two tables by test type and by platform.
The file opens on a start tab (“ابدأ هنا”, Start here) that explains how to use it.
What makes it different
You log each test once and get the difference, its significance and a verdict. You stop picking the "best" ad by eye from the platform dashboard, and you learn which types of test actually help you and which need more data.
How to use it
- In the "الإعدادات" (Settings) sheet, choose the confidence level (90, 95 or 99), check the minimum conversions per version, and edit the lists of test types and platforms if you want.
- In the "الاختبارات" (Tests) sheet, record each test in a row: its name, the platform, the test type from the list, and the start and end dates.
- For each version (A is the original, B is the new one), enter impressions, clicks and conversions from the platform dashboard after the test has finished.
- Let the grey columns calculate: CTR and CVR for each version, the relative difference, the z statistic and the final verdict.
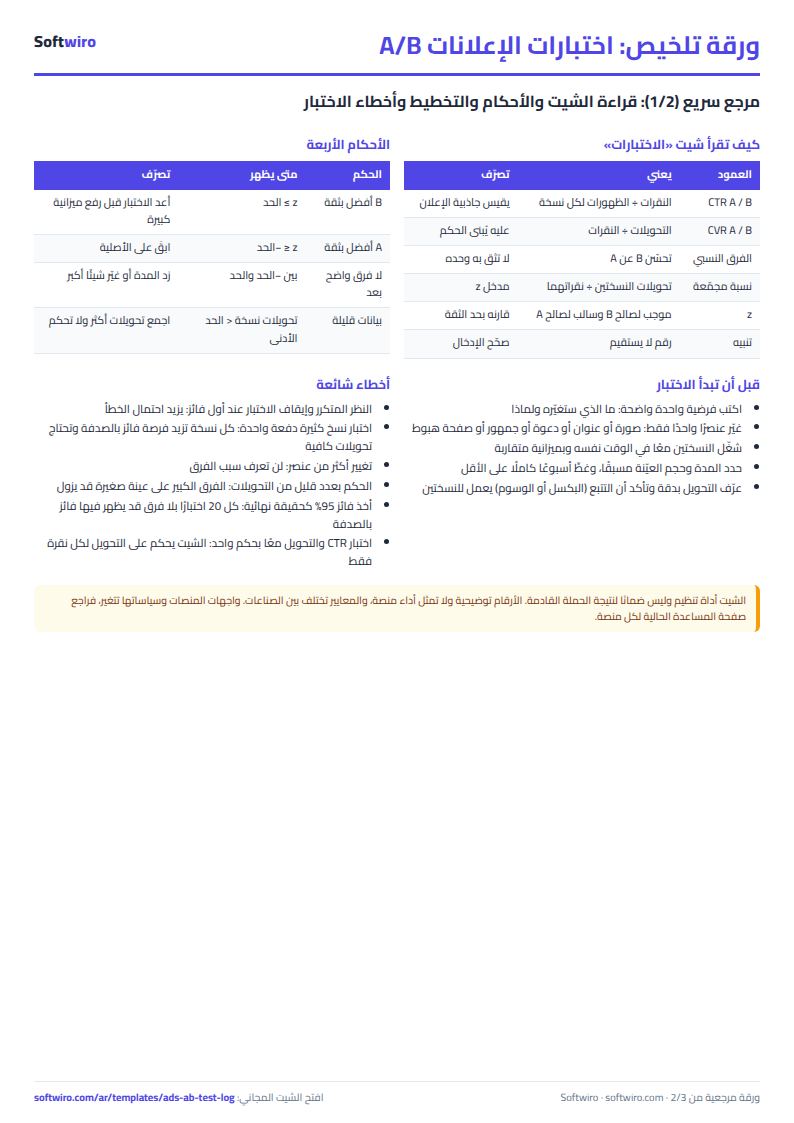
- Read the verdict column: "B better with confidence", "A better with confidence", "no clear difference yet" or "too little data". Watch the alert column if you entered a number that does not add up.
- Open the "الملخص" (Summary) sheet to see the number of tests, the win rate of new versions, the average improvement of the winners, and two tables by test type and by platform.
Before you start:
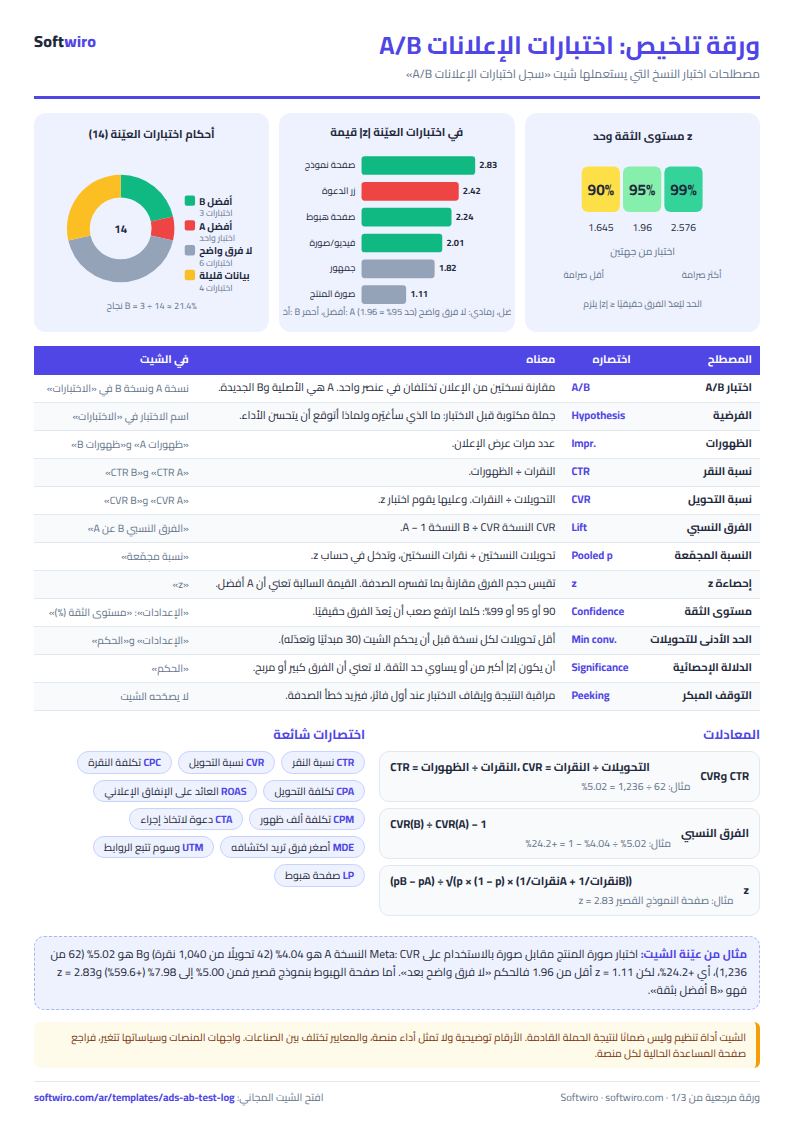
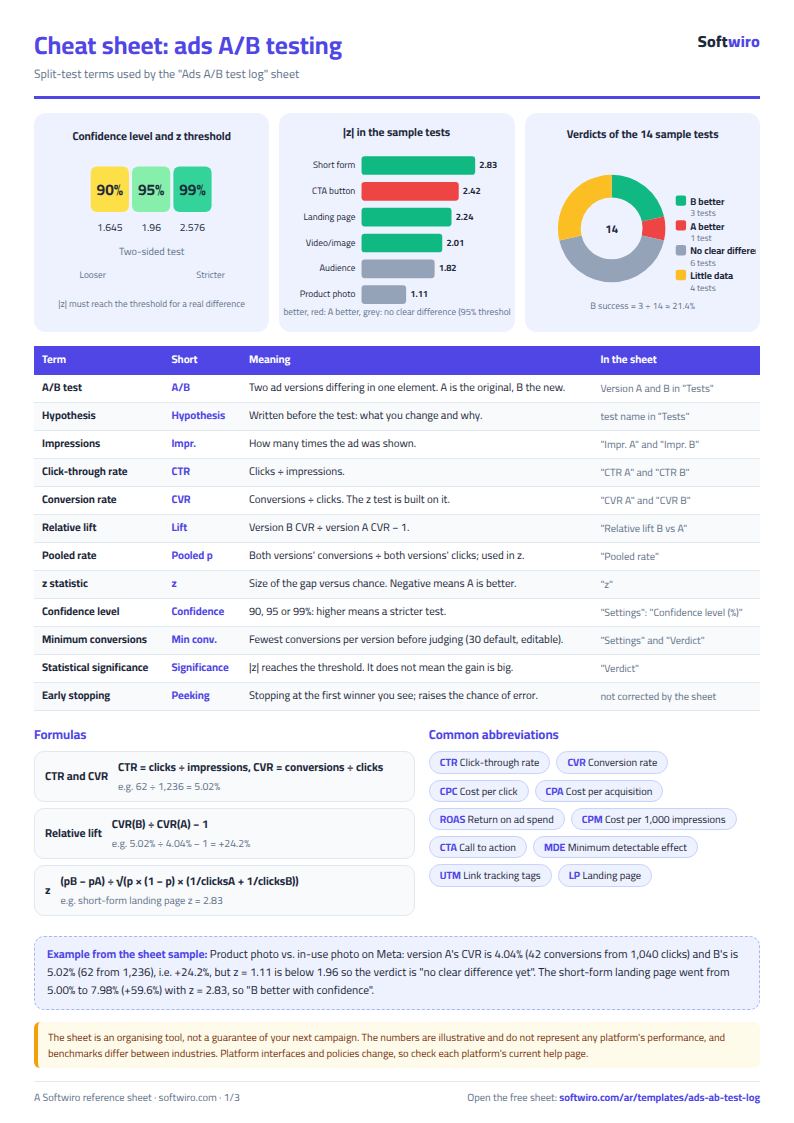
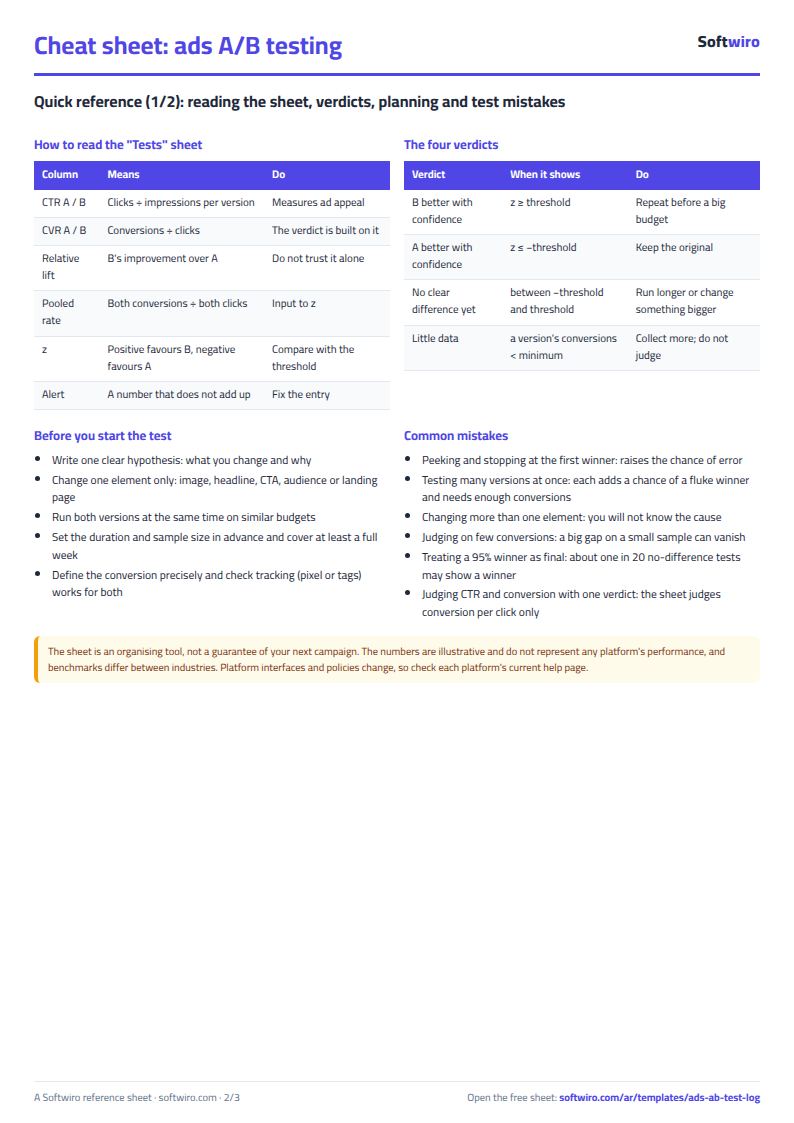
- CTR = clicks ÷ impressions, CVR = conversions ÷ clicks, and relative difference = CVR of B ÷ CVR of A − 1.
- The z statistic compares the conversion rate per click of the two versions using a pooled rate: z = (pB − pA) ÷ √(p × (1 − p) × (1/clicksA + 1/clicksB)). The difference counts as real if the absolute value of z is greater than or equal to the confidence threshold (1.645, 1.96 and 2.576 for 90, 95 and 99).
- The minimum conversions per version (30 in the example) is an editable default, not a fixed rule. Any test where one version has fewer than that shows "too little data" and gets no verdict.
- The sheet only tests the conversion rate per click. It does not test CTR, ROAS or order value. It assumes a large enough sample, and it does not correct for comparing several versions or for stopping a test early at the first good result.
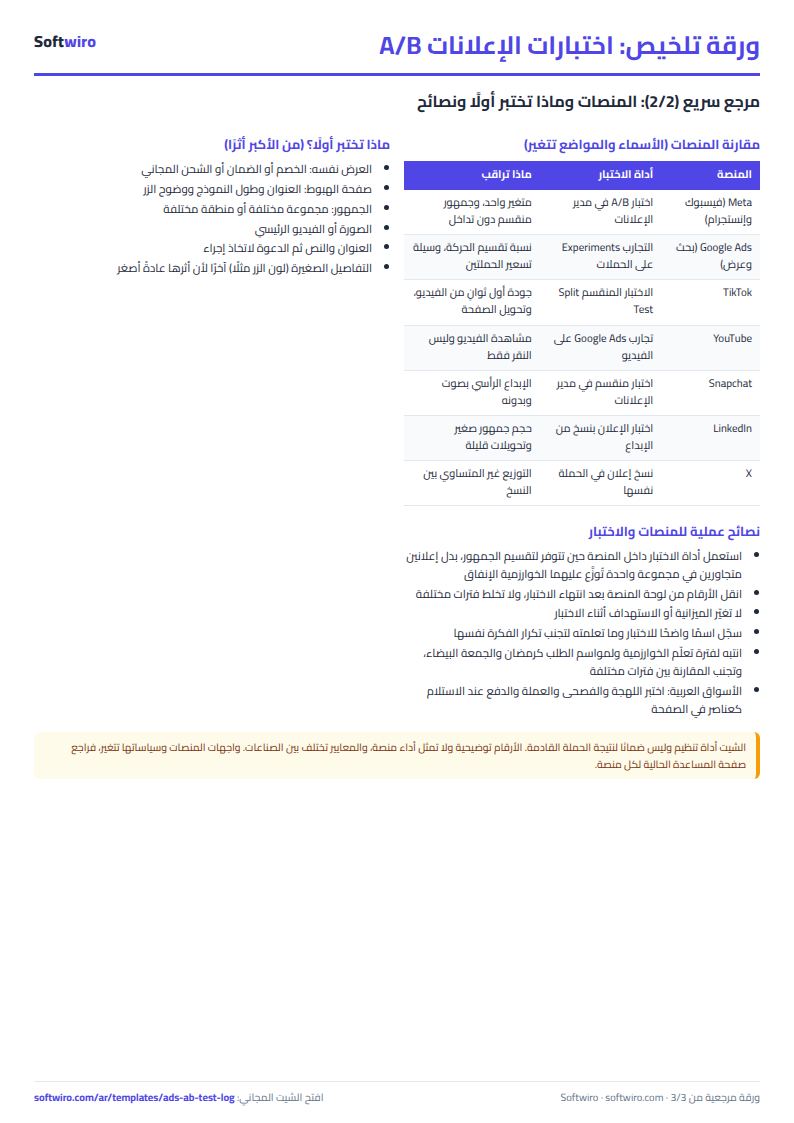
- If you log many tests at 95%, expect some of them to show a winner by chance alone. Treat the result as evidence and repeat the test before you build a large budget on it.
- The sheet holds 200 tests with two versions only (A and B). The numbers in the example are illustrative and do not represent real performance on any platform.
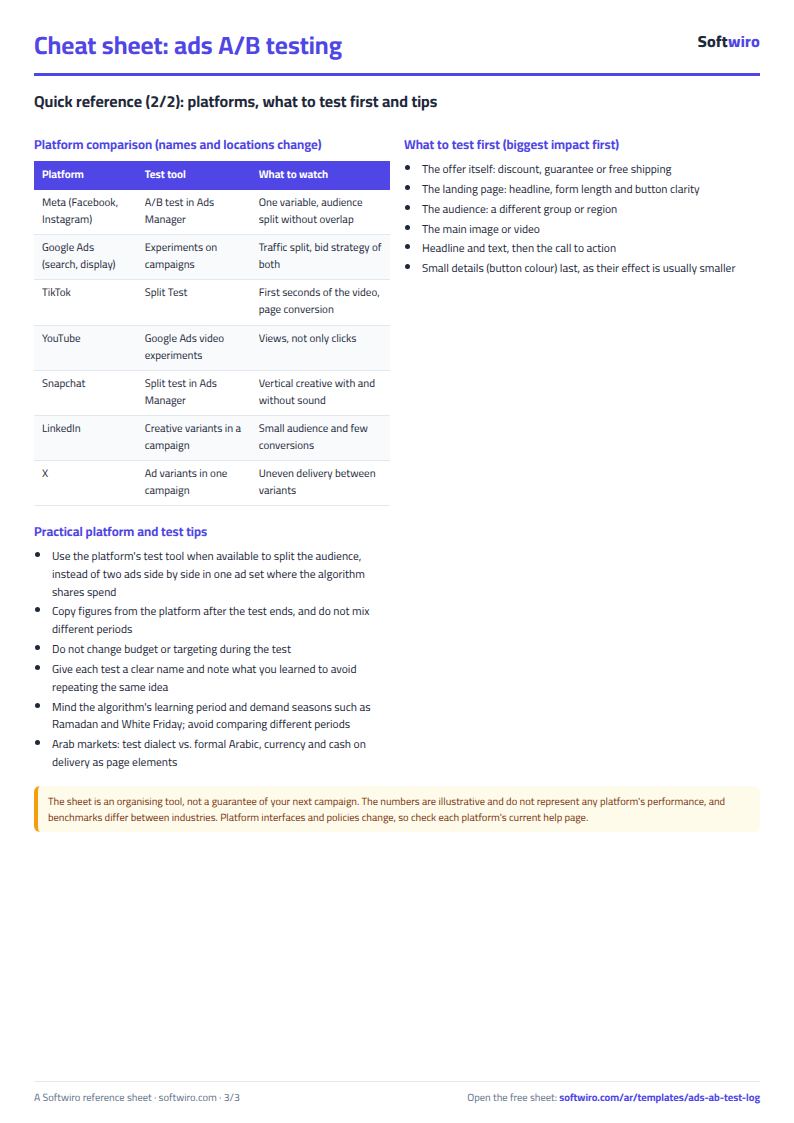
Free cheat sheet for this field
Terms, abbreviations, tables and diagrams over several pages, in Arabic and English. Download it as a PDF or images, including a phone-size version.
Still running this on Excel?
This sheet suits a start and a limited amount of data. If your way of working grows, or you need more than one person working on it at the same time, Softwiro can build you a program that fits the way you work.
| In this sheet | In Custom Software from Softwiro |
|---|---|
| One file that one person edits at a time, and copies reach you on WhatsApp. | A program with a login for each user and permissions you define, and everyone sees the same data. |
| You type everything and check the numbers by hand. | We design the screens around your work steps, so each person records only what concerns them. |
| Columns and formulas are fixed as the sheet was designed. | We build what you need: reports, alerts and screens your way. |
| Backups and security are your own responsibility. | The program runs on a secured server with regular backups. |
Frequently asked questions
How do I know ad B is really better than A and not just luck?
The sheet compares the conversion rate per click of the two versions with a z test: z = (pB − pA) ÷ √(p × (1 − p) × (1/clicksA + 1/clicksB)), where p is the pooled rate. If the absolute value of z reaches the confidence threshold (1.645, 1.96 and 2.576 for 90, 95 and 99), it writes "B better with confidence". In the sample, the landing page test shows 5.00% against 7.98% with z = 2.83, which is a real difference at 95%.
Why does it say "too little data" when B looks better?
Because one of the versions has fewer conversions than the minimum set in "الإعدادات" (Settings), which is 30 to start. This is an editable assumption, not a fixed rule. In the sample, a brand-name headline test has 15 conversions for A and 21 for B and a relative difference of +30.3%, but the sheet gives no verdict until more conversions come in.
Is a winner at 95% confidence enough to raise the budget?
No. 95% means roughly one test in twenty with no real difference can still show a winner by chance. The sheet also does not correct for comparing several versions or for stopping early at the first good result. Treat the result as evidence, and repeat the test before you build a large budget on it.
Are the numbers in the sheet real platform performance?
No. The sample numbers are illustrative and do not represent real performance on any platform, and the sheet does not promise any click or conversion rate for any industry. Platform interfaces and policies change, so copy your numbers from the platform dashboard after the test ends.
Is the template free?
Yes, with no sign-up and no email address. Use it, edit it and share it as you like.
Does it work in Google Sheets and on mobile?
The sheet uses formulas supported by Excel 2016 and later, Google Sheets and LibreOffice, so you can upload it to Google Drive and open it with Google Sheets on a computer or a phone.
What is the difference between the white and the gray cells?
You type in the white cells; the gray cells are calculated automatically. Don't type in a gray cell, or you will erase its formula.
Can I use the sheet from an AI assistant?
Yes. Add our MCP server (URL https://softwiro.com/api/mcp, no key needed) to your assistant and ask it to do the calculation in this template. The numbers come from the sheet's own formulas, and we do not store your data. The steps and a ready-made prompt are in this article: https://softwiro.com/blog/mcp-excel-templates-ai-agent-guide.html
All the templates in this group: Excel templates for paid ads: budget, performance and reports
More free templates for: Marketing and advertising
More free templates
- Ad budget media plan across platforms
- Ad campaign performance tracker
- Ads break-even and unit economics sheet
- Ad agency client management and reports
- UTM link builder and campaign naming
- Ad account audit checklist
- Ads creative production calendar
- Ads lead quality tracker
- Media buyer rules sheet: ad formulas, scaling rules and testing discipline
- Cash flow forecast sheet
- Annual budget by department: plan vs actual
- Project budget vs actual sheet
- Simple daily expense sheet (phone-first)
- Multi-warehouse and branch inventory sheet with transfers
- Periodic stock count and count-difference reconciliation sheet
- Restaurant and cafe inventory and waste sheet
- Spare parts inventory sheet