Halfway through the year, or near its end, you want to know which department has overspent its budget, which line is draining it, and where the year will land if spending continues like this. The free annual budget by department sheet answers that: you set a plan per department and budget line over 12 months, log the actuals, and the sheet compares them by month and year to date and forecasts the year end.
The problem it solves
A budget written in January and forgotten until December helps nobody. When each manager speaks about their department with different numbers, management cannot tell who overspent and who saved. You need one plan with the same names and lines, actuals recorded once, and a comparison that updates whenever you add an entry.
How the sheet works, step by step
- In Settings you type the year, the month you compare up to, and the alert percentages for expenses (near the limit) and for revenue.
- In Lists you type your departments or cost centers and your budget lines, with each line's type: revenue or expense.
- In Plan you add a row per department and line and type the planned amount for each month. The sheet totals the year and warns if a row is duplicated.
- In Actual you log each transaction: date, department, line and amount. If the department or line is not in the lists, or has no plan, the row gets a warning.
- You read By department and By line to see, for each, the period plan, actual, variance, spending percentage and status, and Departments monthly and Lines monthly for the detail of each month.
- You open Budget summary for revenue, expenses, net, alerts and the year forecast.
What each sheet holds
- Budget summary: revenue, expenses and net to the chosen month and for the full year with its forecast, the number of departments and lines over plan, the biggest overspenders, a monthly table, and four charts.
- By department and by line: one table for expenses and one for revenue, with the yearly plan and forecast.
- Departments monthly and Lines monthly: plan, actual and variance for each month.
- Plan, Actual, Lists and Settings: the sheets you type in.
Walk-through on the sample numbers
This is sample data, not a real company: eight departments and ten lines, compared up to the end of October 2026 (month 10), plus a few early November entries that do not count in "to the chosen month":
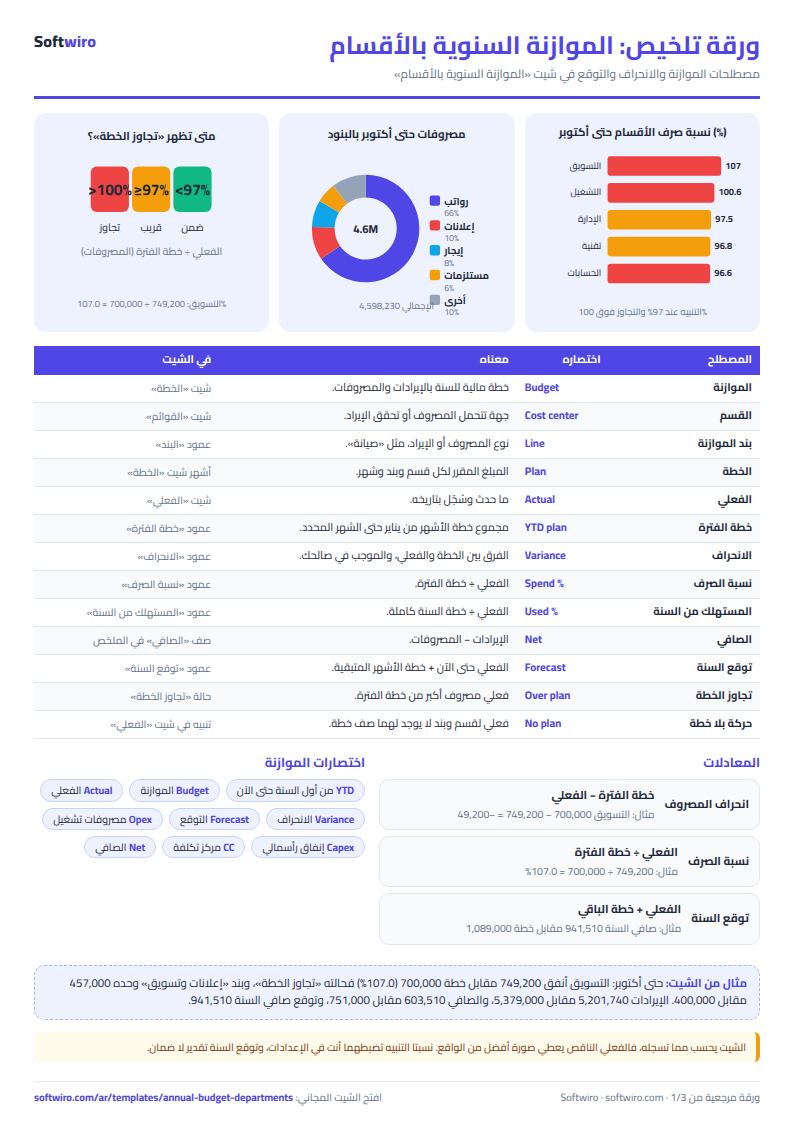
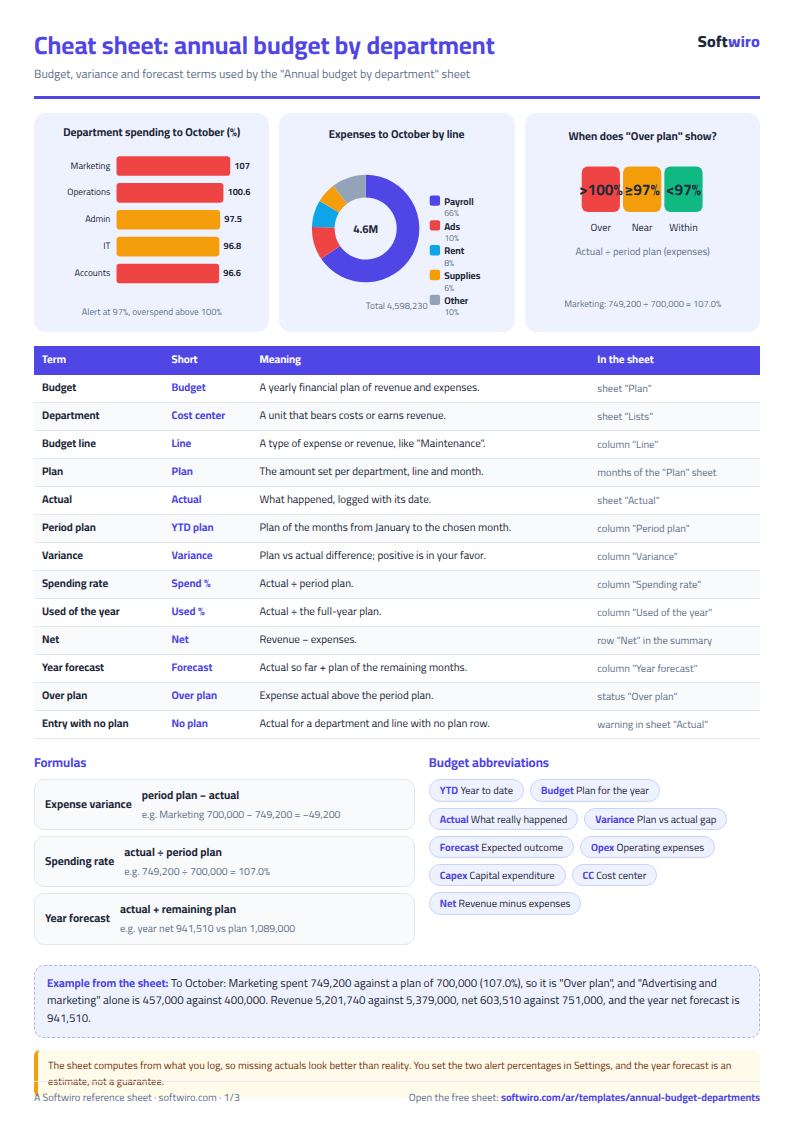
- Expenses: plan to October 4,628,000, actual 4,598,230, a spending rate of 99.4%, with 29,770 variance in your favor. But two departments overspent: Marketing spent 749,200 against a plan of 700,000 (107.0%) and Operations 1,277,030 against 1,270,000 (100.6%). Administration is "near the limit" at 97.5%.
- Why: by line, "Advertising and marketing" is 457,000 against 400,000 (114.2%), "Maintenance" 159,550 against 140,000 (114.0%) and "Travel" 114,870 against 110,000 (104.4%). Marketing also has a 1,200 travel expense with no plan, which the sheet flags in yellow.
- Revenue: plan 5,379,000, actual 5,201,740 (96.7%), which is 177,260 short. "Product sales" is below plan at 95.2% while "Service revenue" met its plan (102.6%).
- Net: plan 751,000, actual 603,510, so the variance is 147,490 against the plan.
- Full year: plan revenue 6,685,000, expenses 5,596,000, net 1,089,000. The forecast (actual so far + remaining plan) is revenue 6,507,740, expenses 5,566,230 and net 941,510, which is the same 147,490 below plan.
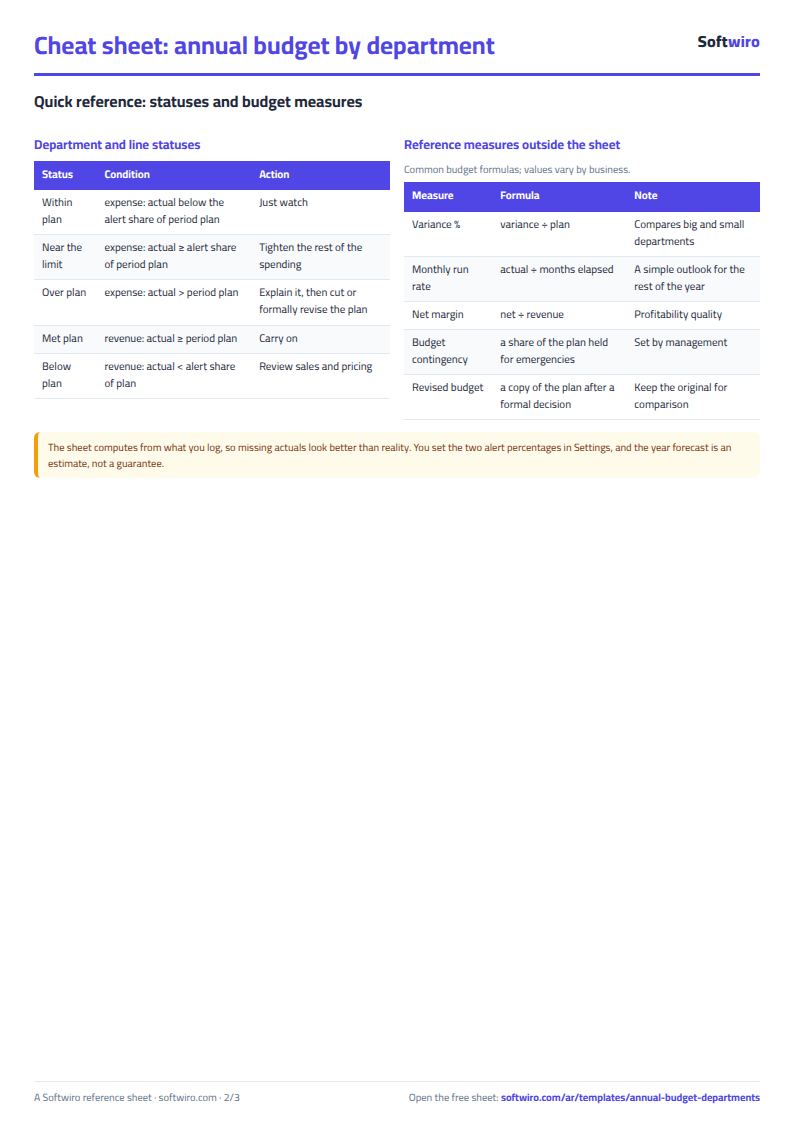
The practical reading: Marketing and Operations need a decision before November, either cutting the rest of their advertising and maintenance or formally revising the plan. Sales should review product revenue.
Why it helps
- Plan and actual with the same names: no manual matching between the manager's file and the accountant's.
- Month and year to date together: you see whether an overspend is a one-month blip or a build-up over the year.
- Both revenue and expense sides: you do not judge a department on cost alone if it earns revenue.
- Year-end forecast: it turns current numbers into a decision: change the plan or change the spending?
- Works in Excel 2016 and later, Google Sheets and LibreOffice, free with no sign-up.
Common mistakes
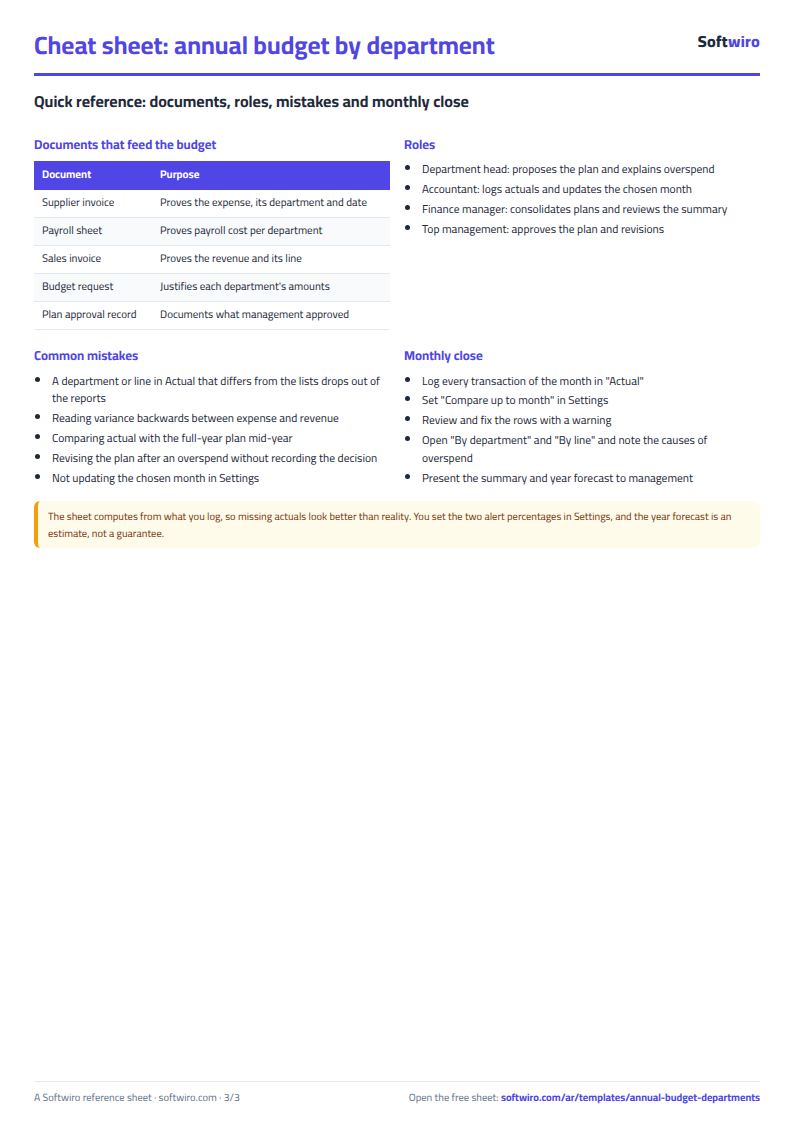
- Logging actuals under names that differ from the plan: pick department and line from the list so they match.
- Mixing positive and negative variance: positive is always in your favor, plan minus actual for expenses and the reverse for revenue.
- Comparing actual with the full-year plan mid-year: compare it with the period plan, and use "consumed of the year" to see what is left.
- Forgetting a line you never planned: the "no plan" warning tells you; add a plan row or correct the department.
- Leaving the chosen month stale: change it in Settings every month.
When to move to a system
The sheet suits a small or mid-sized company whose accountant collects numbers from departments and types them in. When invoices and payments multiply and become hard to carry over, Accountwiro records the invoice and the payment at the moment they happen and shows each customer's balance in one statement. If what matters now is the monthly expenses of one business, see the business expenses and budget sheet.
Frequently asked
How many departments and lines fit? Twelve departments, twenty lines, 300 plan rows and 2,000 actual entries.
Do I need a full year of actuals? No. Choose the month you compare up to and the tables count up to that month.
Can one department have revenue and expenses? Yes; it shows in both tables according to the types of lines planned for it.
Your next step
Open the sheet, type your departments and lines, copy this year's plan into the Plan sheet, then log last month's actuals and see which department goes over first.