Many advertisers judge a campaign by the cost per lead on the platform dashboard. A campaign can bring cheap leads who never answer, or give wrong numbers, while a dearer one brings buyers. The free ads lead quality tracker records each lead with its campaign and status and shows, per campaign, the cost per lead, the cost per qualified lead, the customer acquisition cost (CAC) and the ROI, so you judge by sales and not by leads alone.
The problem it solves
Platform dashboards count leads, not sales. Between the lead and the sale sit people who did not answer, people who were not interested, people who left a wrong number and people who were contacted too late. Here you enter the lead once, update its status as it moves, and the sheet works out the rest for every campaign and for the whole account.
Steps from opening the file to the report
- Settings: the start and end of the reporting period and its number of months, then your campaigns (up to 15) with each one's platform and monthly spend.
- Leads: log each lead in a row: the arrival date, the campaign from the list and a code such as L-0001 that carries no name or number.
- Update the status from the list as the lead moves (New, Contacted, Qualified, Quote, Sold, Not interested, Wrong number), and enter the sale value in pounds when it sells.
- The grey columns (qualified, sold, lead age in days and alert) work themselves out.
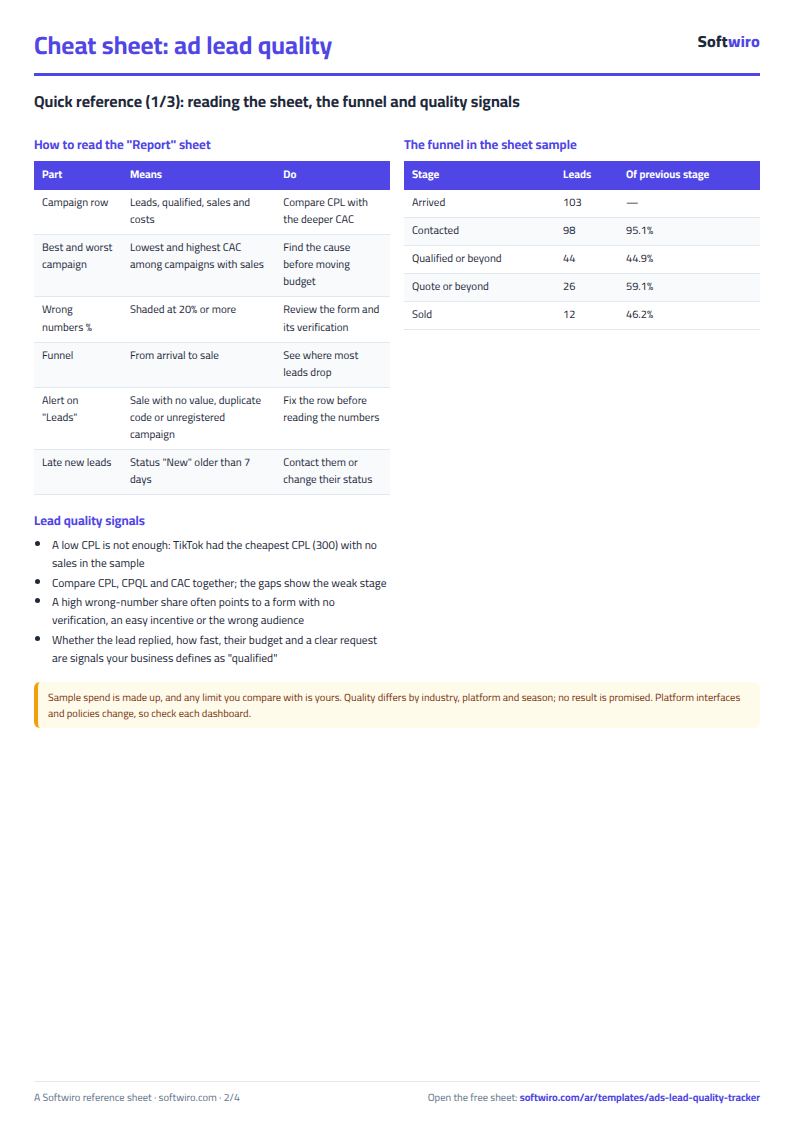
- Open Report for each campaign's leads, qualified leads, sales, costs, close rate, CAC and ROI, the best and worst campaign, the funnel and the share of wrong numbers.
- Check the Alert column on Leads: it flags a sale with no value, a duplicate code or an unregistered campaign.
Worked example (sample data)
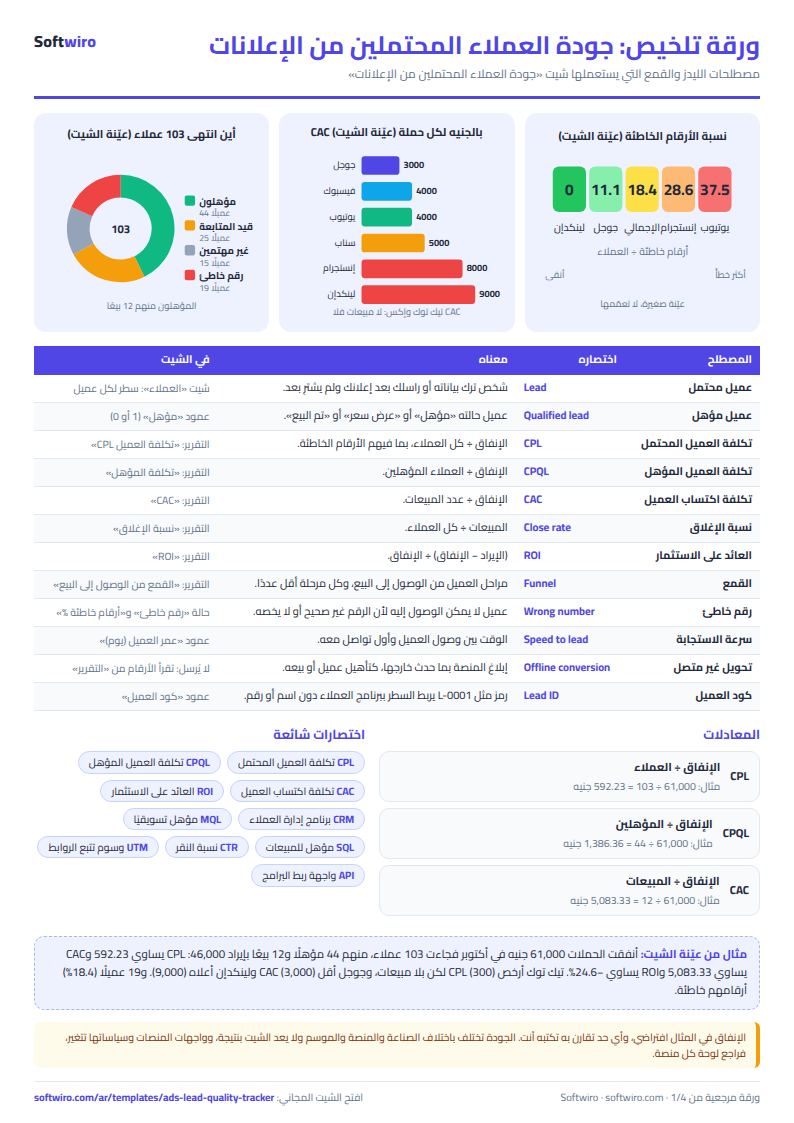
The figures are made up for a sample training centre. The eight campaigns spent 61,000 EGP in October 2026 (one month) and brought 103 leads, of whom 44 were qualified and 12 bought, with revenue of 46,000:
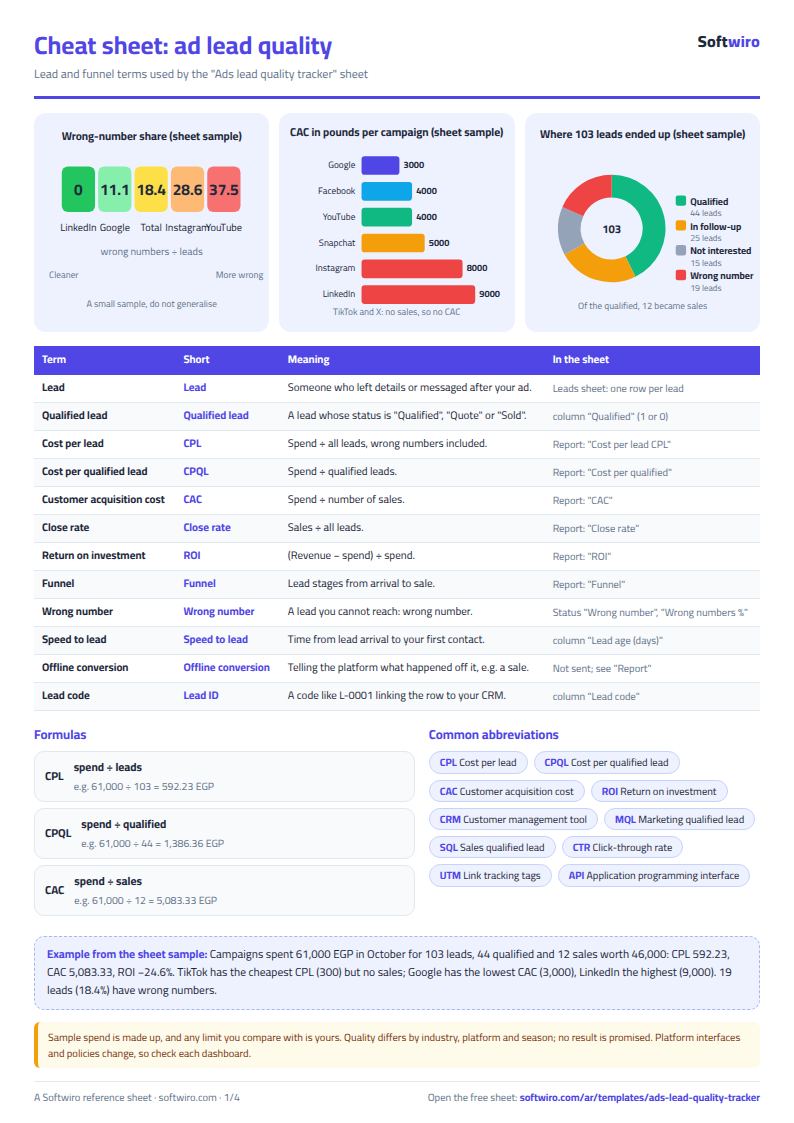
- Totals: CPL 592.23, cost per qualified lead 1,386.36, close rate 11.7%, CAC 5,083.33 and ROI −24.6%.
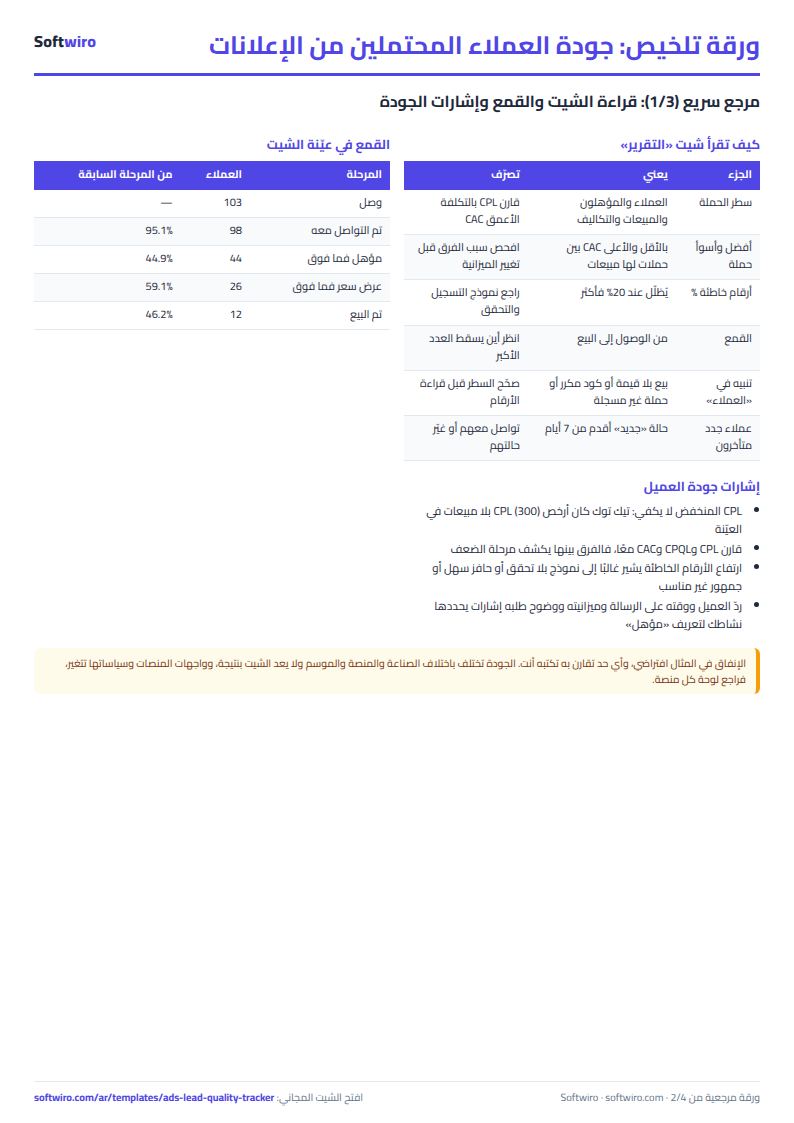
- Funnel: 103 arrived, 98 were contacted (95.1%), 44 qualified (44.9% of those contacted), 26 reached a quote or beyond (59.1%) and 12 bought (46.2%).
- Facebook, summer course offer: 12,000 spent, 22 leads, 10 qualified, 3 sales (13.6%), CAC 4,000, revenue 13,000 and ROI +8.3%.
- Google search: 15,000 spent, 18 leads, 13 qualified, 5 sales (27.8%), CAC 3,000, the lowest in the sheet, revenue 14,000 and ROI −6.7%. It is the best campaign by CAC, even though its CPL (833.33) is among the highest.
- TikTok: the cheapest CPL (300), but 20 leads gave 5 qualified and no sales, so it has no CAC and its ROI is −100%.
- LinkedIn: only 6 leads with CPL 1,500, one sale and the highest CAC, 9,000, so it is the worst campaign by CAC.
- Wrong numbers: 19 of the 103 leads (18.4%). The share is highest on YouTube (37.5% of 8 leads), Instagram (28.6%) and Snapchat (27.3%); the sheet shades 20% or more.
- Statuses: New 5, Contacted 20, Qualified 18, Quote 14, Sold 12, Not interested 15, Wrong number 19.
- Late leads: 6 leads are still "New" for more than 7 days, and the report counts them. The sheet also holds 6 leads that fall outside October to show that the report counts only the chosen period.
How the numbers are worked out
- CPL = spend ÷ leads, cost per qualified lead = spend ÷ qualified leads, CAC = spend ÷ sales.
- Close rate = sales ÷ leads, ROI = (revenue − spend) ÷ spend.
- Qualified lead: one whose status is Qualified, Quote or Sold; this definition is fixed in the formulas.
- Spend = the monthly spend × the number of months in the period.
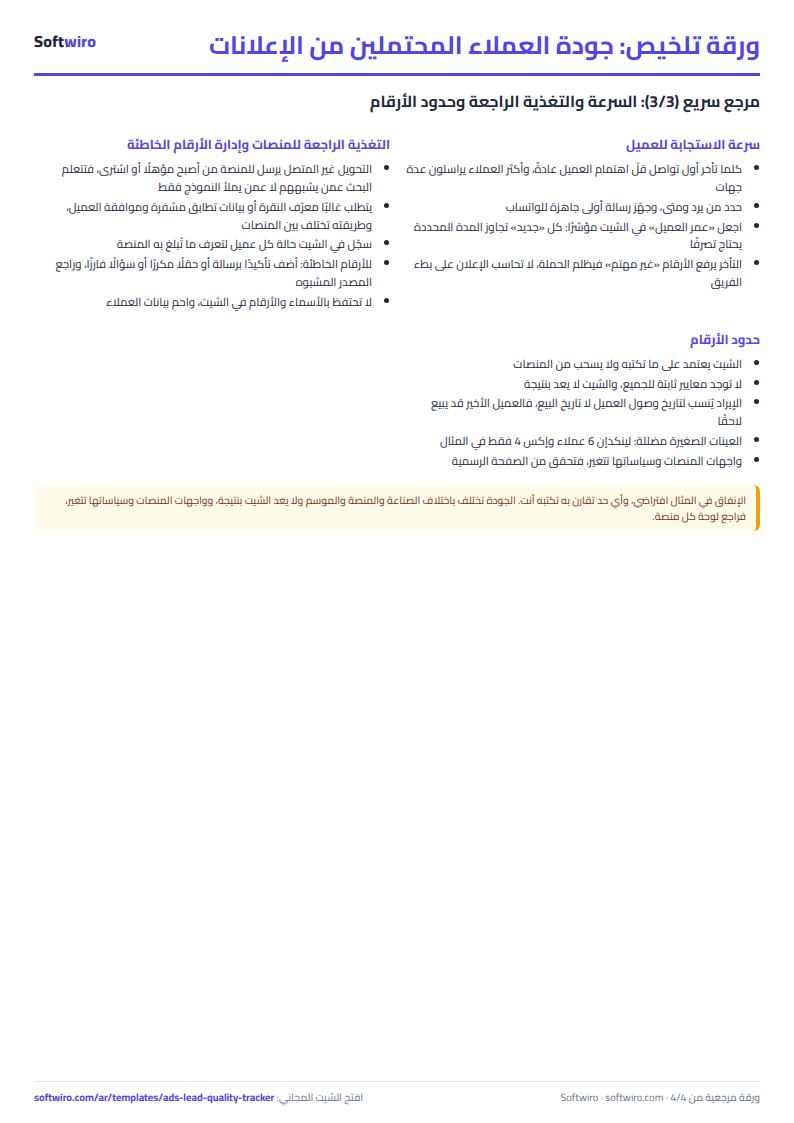
- Revenue is tied to the lead's arrival date, not the sale date.
Beyond the sheet: speed and feedback to the platforms
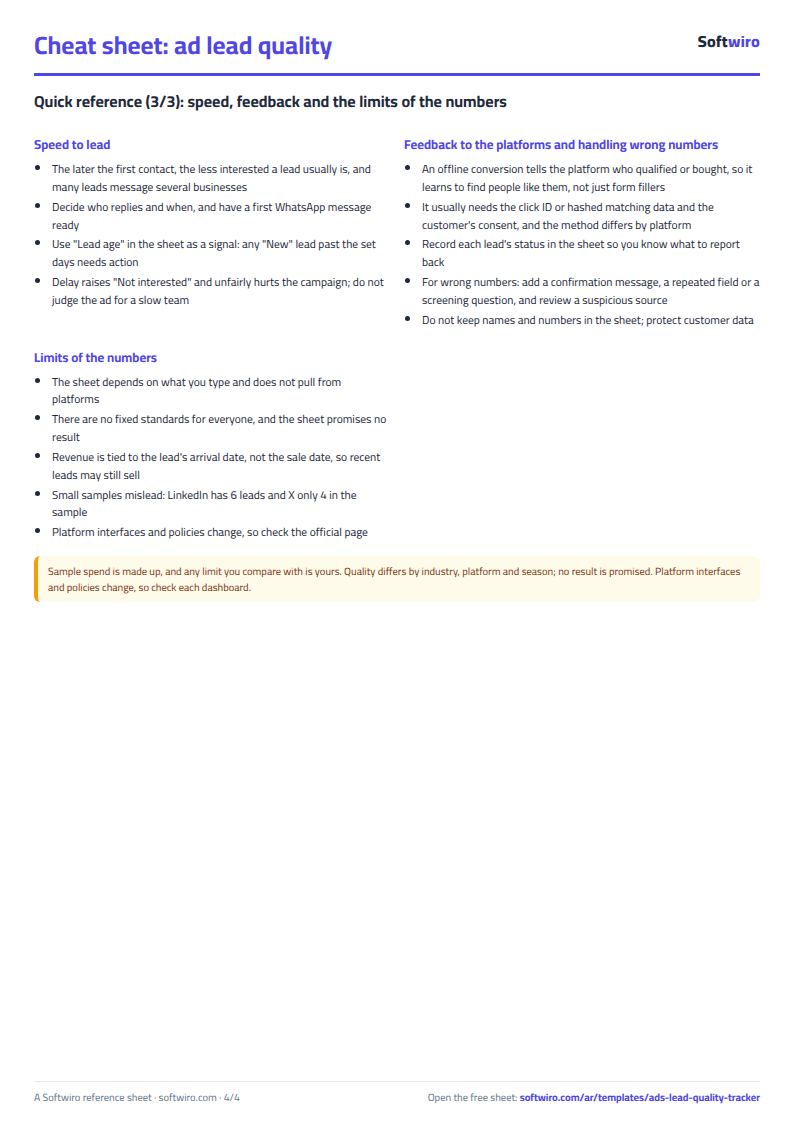
- Speed to lead: the later the first contact, the less interested a lead usually is, and many leads message several businesses. The sheet shows each lead's age and counts the "New" ones that waited too long, but it does not message anyone. Do not judge an ad for a slow team.
- Feedback to the platforms: several platforms let you report back who qualified or bought (offline conversions or a conversions API), so delivery learns from real customers and not from form fillers. The method, the identifiers it needs and the customer's consent differ by platform. This sheet sends nothing; it only shows which statuses and sales you would report.
- Wrong numbers: a confirmation message, a repeated field or a screening question in the form often cuts them, and the source is worth reviewing if one campaign stands out.
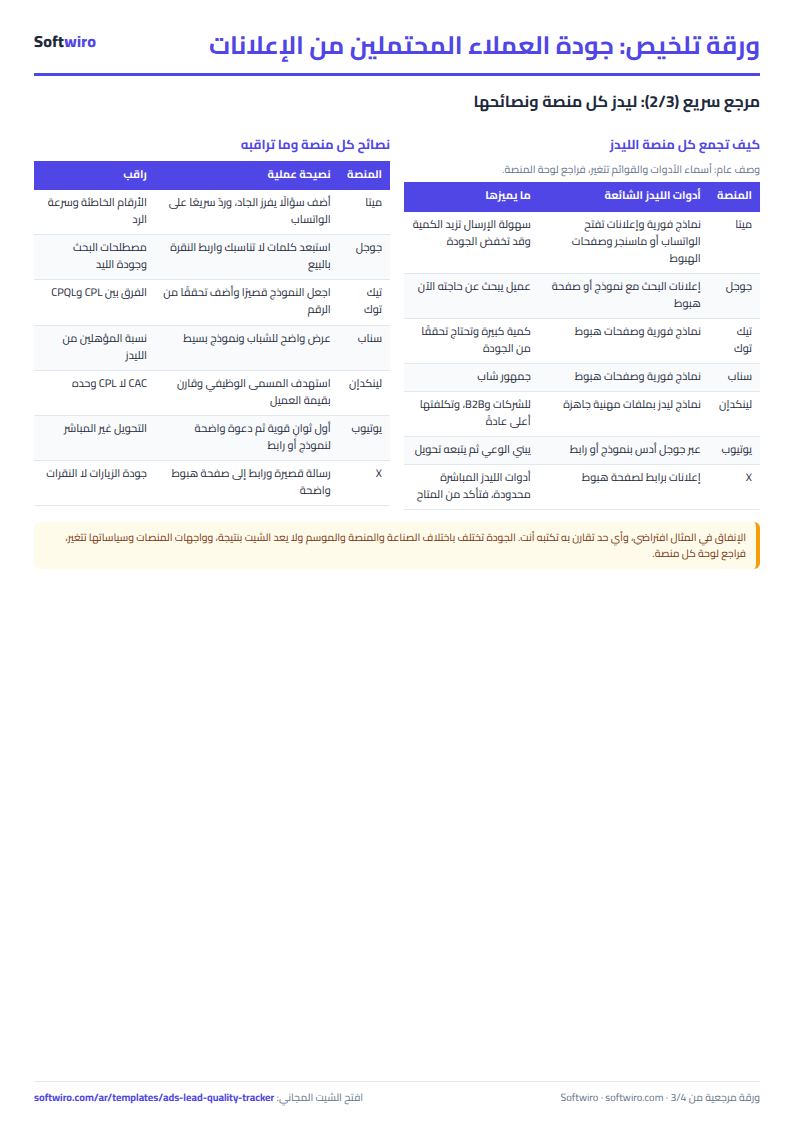
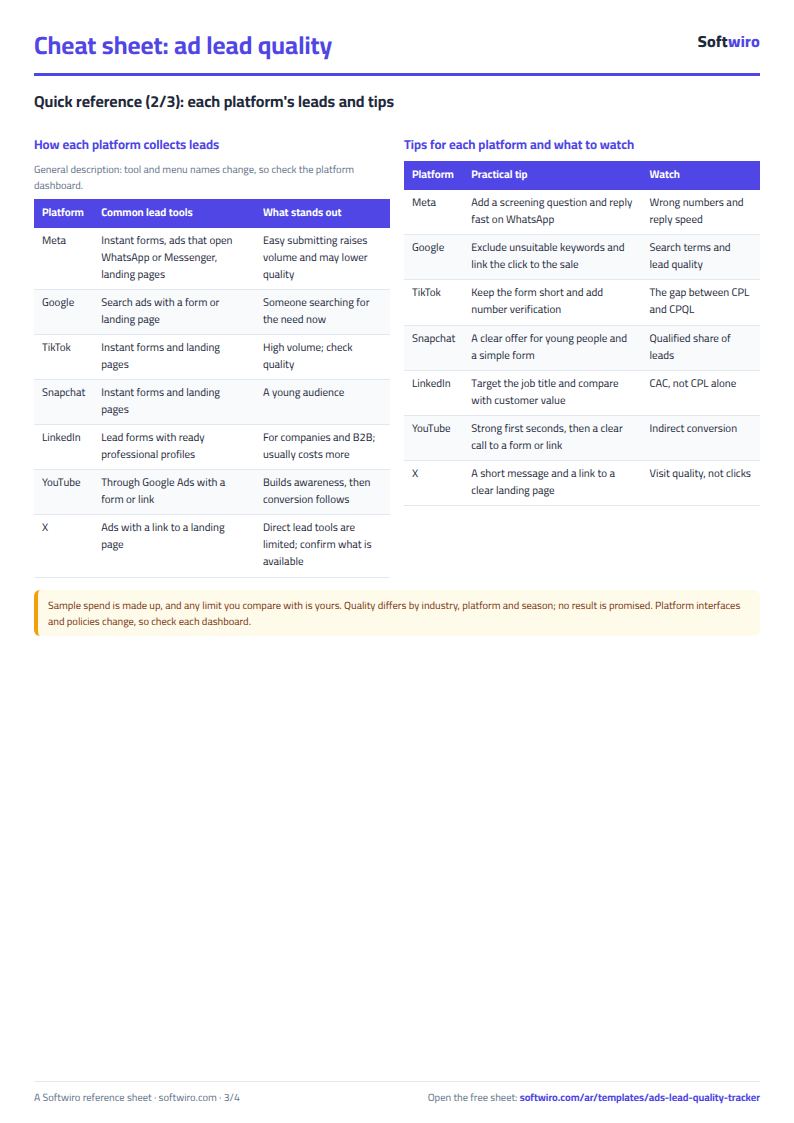
- Platform notes: the forms and the WhatsApp or Messenger ads of Meta make sending easy, which can raise volume and lower quality. Search ads reach someone looking for the need now. LinkedIn lead forms suit B2B and usually cost more per lead, so compare with the value of a customer. Check each platform's current tools, since they change.
Limits and tips
- The sheet depends on what you type. It pulls nothing from the platforms, so enter the real spend from each dashboard.
- Benchmarks differ by industry, platform and season. The sheet promises no result and sets no standard; any limit you compare against is one you write.
- Small samples mislead: LinkedIn has 6 leads and X only 4 in the sample, so do not decide on them alone.
- Do not rename the seven statuses in Settings, and do not delete a row from the middle of the campaign list.
- Keep names and phone numbers in your CRM, not here, and tie the row to its code only.
- A campaign missing from Settings still counts in the totals but has no row; it appears on the "unregistered campaigns" line.
- Platform interfaces and policies change, so check each platform's official page.
Try it
Open the sheet and try it online, or download it for Excel. It holds 1500 leads and 15 campaigns. If you want an app that pulls your leads and spend from the platforms and alerts your team, ask for it here.