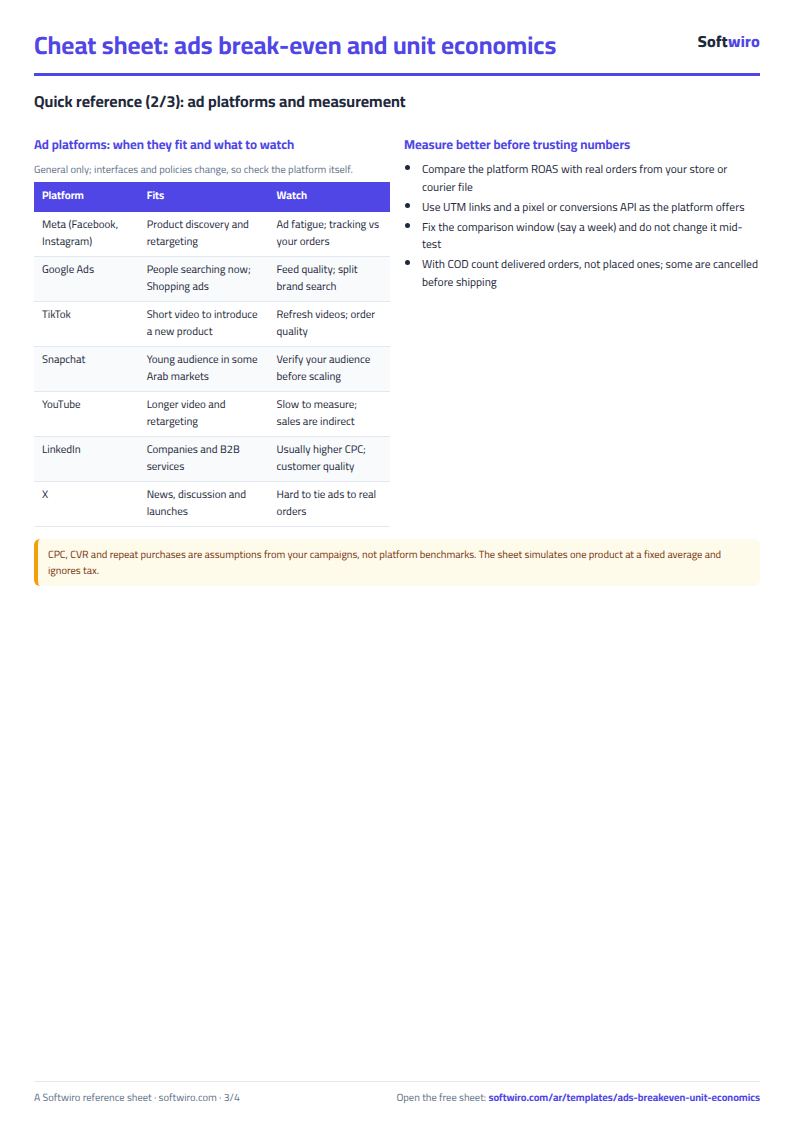
Anyone running paid ads knows the ROAS a platform shows is not enough: a 3 can look excellent while you lose money because shipping, returns and payment fees ate the margin. The free ads break-even and unit economics sheet works out each order's margin, the break-even ROAS and the maximum cost per order, then simulates your monthly budget, so you know before you spend whether the product can carry the ads.
The problem it solves
In cash-on-delivery stores, costs pile up that the ad dashboard never shows: the cost of goods, shipping on every order, collection fees, and orders that are refused or returned. So you judge an ad by the platform number alone, and a thin-margin product can lose at a ROAS that looks acceptable. Here you enter each product's costs once and get the limit your cost per order should not pass.
Steps from opening the file to a decision
- Settings: enter your business name, the target profit margin and the monthly fixed costs (5 items).
- Products in Settings: enter up to 10 products with selling price, cost of goods, shipping, payment or COD fee % and return rate.
- Open Products to see each product's contribution margin, break-even ROAS, max CPA, target CPA and status.
- In Simulation pick the product and platform and enter the budget, cost per click and conversion rate (or a direct CPA) and repeat purchases.
- Read the expected orders, profit after ads and fixed costs, break-even orders and the LTV to CAC ratio.
- Change the price and order change percentages below the simulation to compare a lower and a higher price with the base.
Worked example (sample data)
The figures are sample data for an example store with fixed costs of EGP 28,000 a month (rent 8,000, salaries 15,000, tools 1,500, accountant 1,000, packaging 2,500):
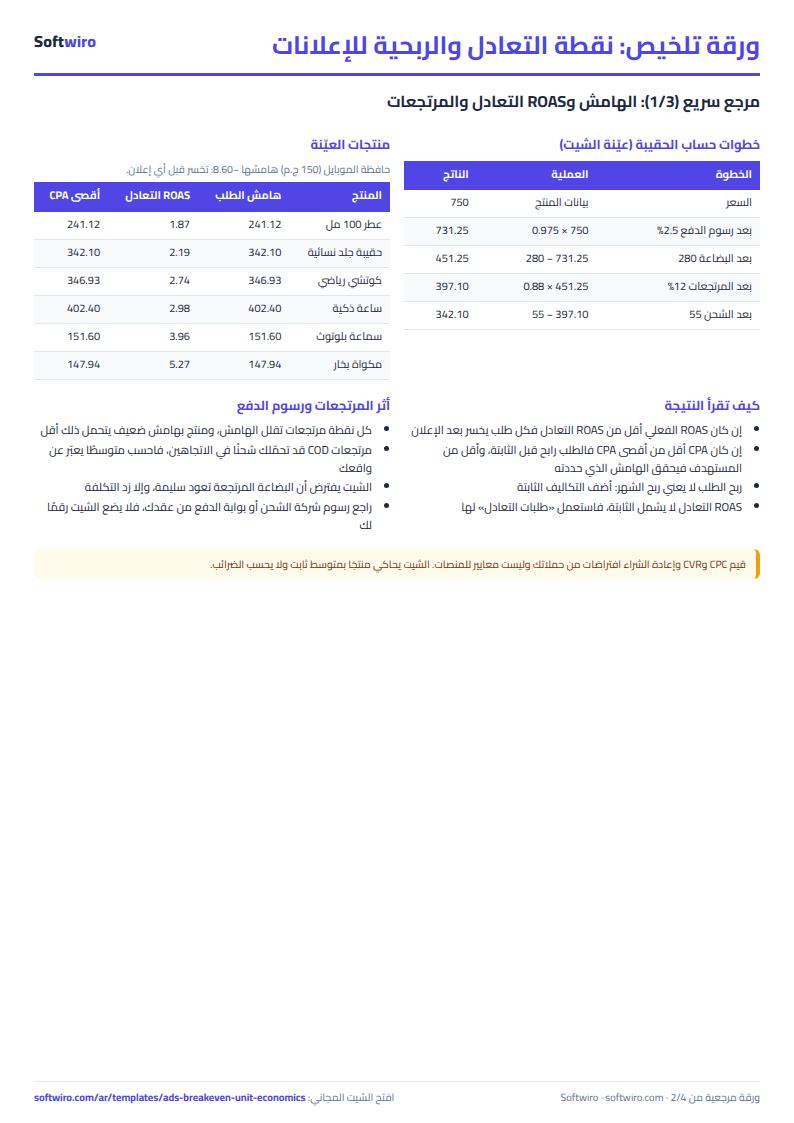
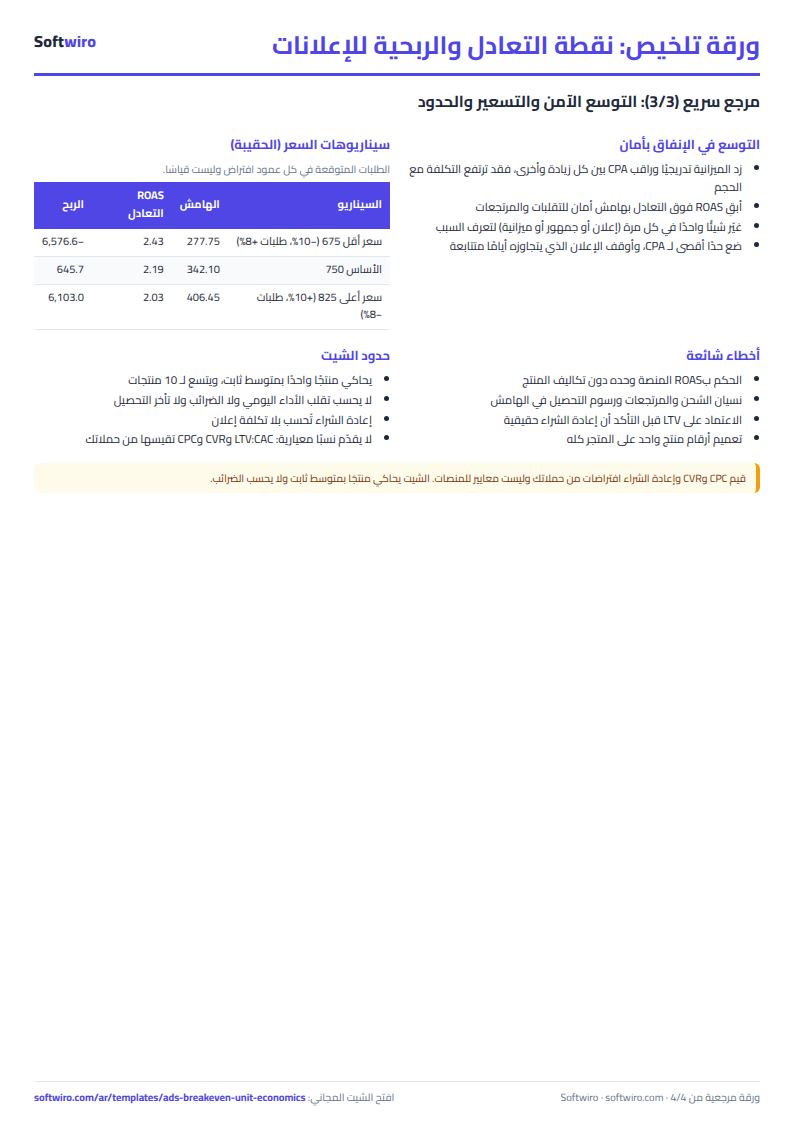
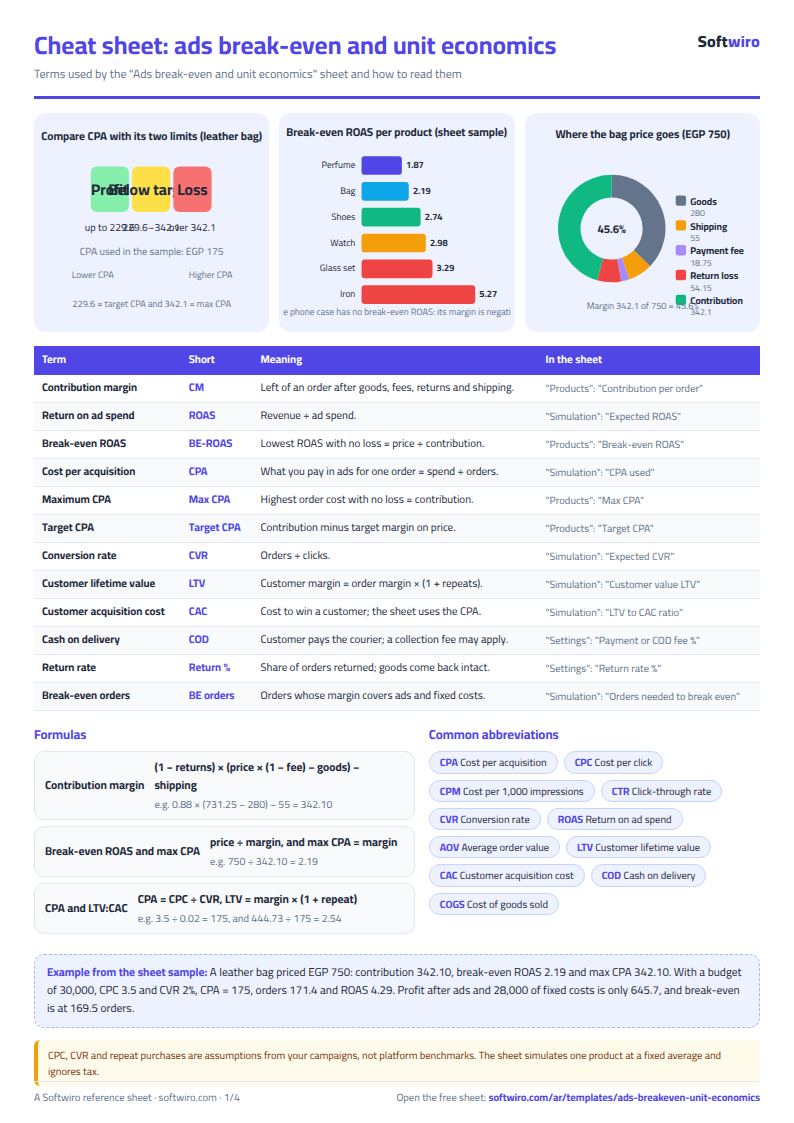
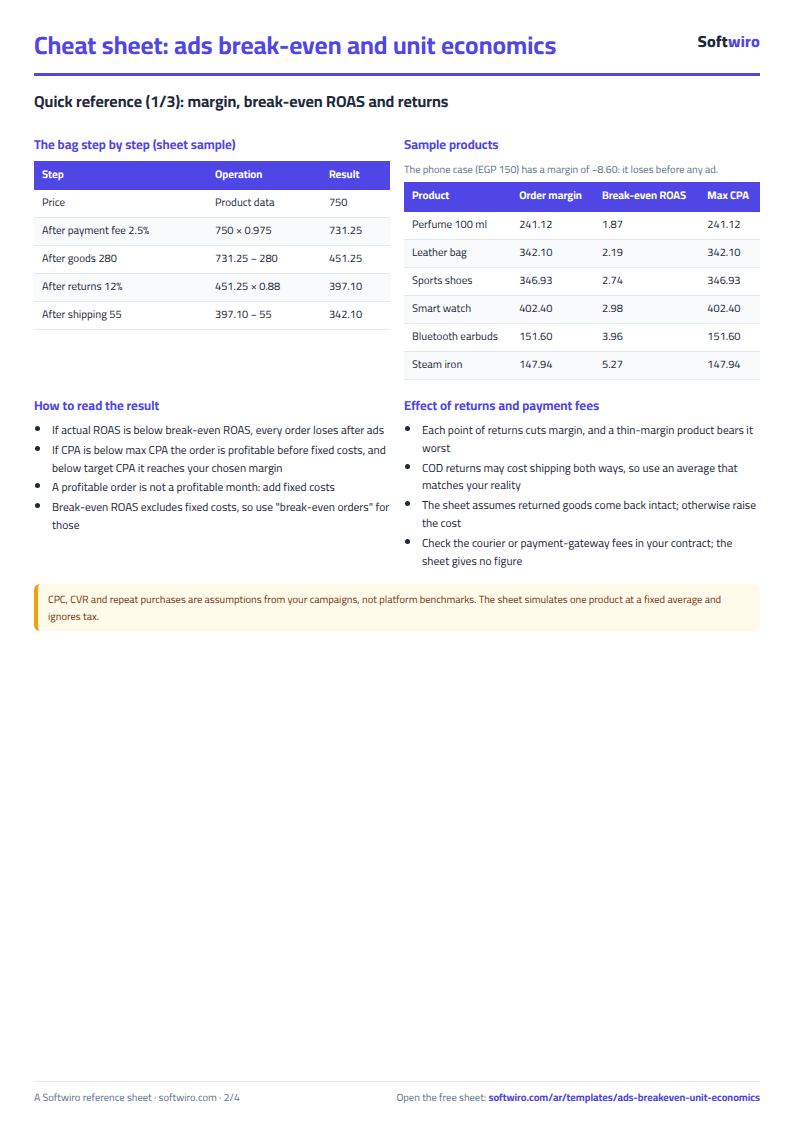
- Women's leather bag priced 750 with goods 280, shipping 55, payment fee 2.5% and returns 12%: after the fee 731.25, after goods 451.25, after returns 397.10, and after shipping a contribution margin of 342.10 (45.6% of price). Break-even ROAS is 2.19 and max CPA 342.10. With a 15% target margin (112.5), target CPA is 229.60 and target ROAS 3.27.
- Simulation with a 30,000 budget on Meta, a cost per click of 3.5 and a conversion rate of 2%: CPA = 3.5 ÷ 0.02 = 175, clicks 8,571.4, orders 171.4, revenue before returns 128,571.4 and ROAS 4.29. Total margin is 58,645.7, so profit after ads and fixed costs is only EGP 645.7.
- Break-even orders: (30,000 + 28,000) ÷ 342.10 = 169.5, so actual orders beat them by only about 1.9. A ROAS of 4.29 does not turn into a large profit when fixed costs are heavy.
- LTV: 342.10 × (1 + 0.3) = 444.73, which is 2.54 times the CAC (175).
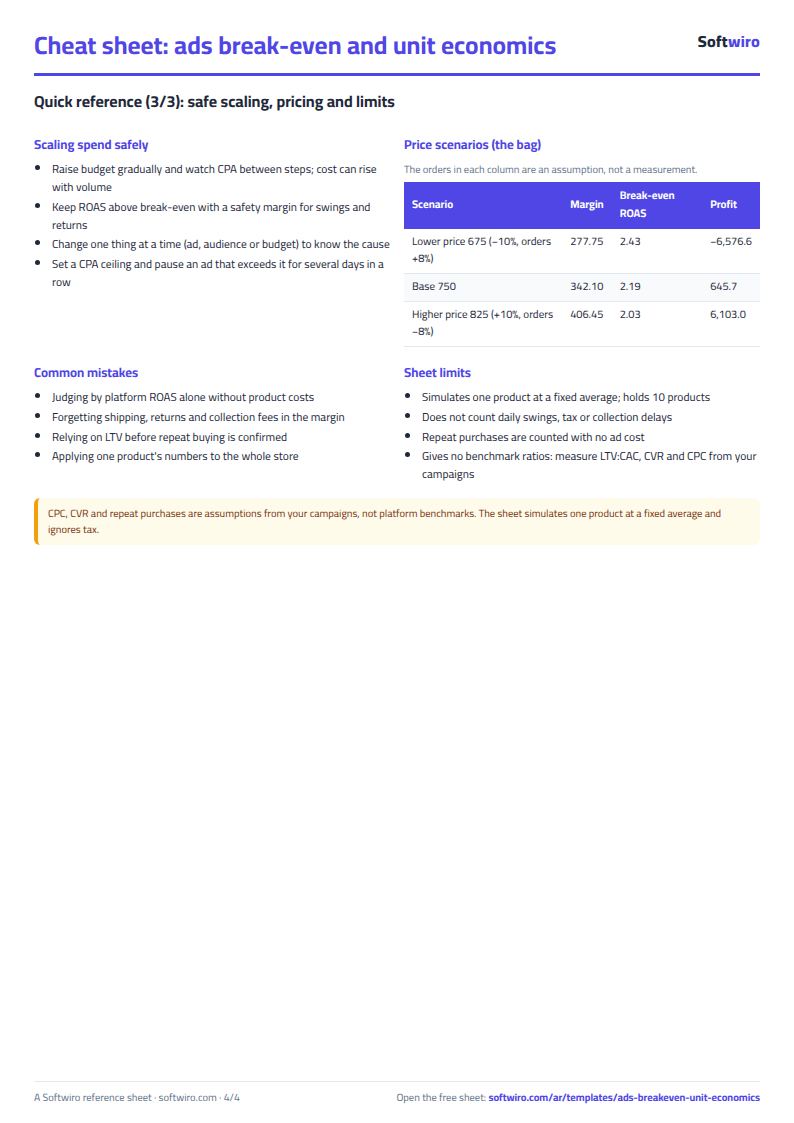
- Price: at 675 (−10%) with orders assumed up 8%, the margin is 277.75, break-even ROAS 2.43 and profit −6,576.6. At 825 (+10%) with orders down 8%, the margin is 406.45, break-even ROAS 2.03 and profit 6,103.0, about 5,457 above the base. The order changes are your assumption, not a measurement.
- Other products: break-even ROAS is 1.87 for the perfume, 2.74 for the shoes, 2.98 for the smart watch and 5.27 for the steam iron. The phone case (EGP 150) has a margin of −8.60, so it loses before any ad and its status is "Loss before ads".
How the numbers are worked out
- Contribution margin = (1 − returns) × (price × (1 − payment fee) − cost of goods) − shipping.
- Break-even ROAS = price ÷ contribution margin, and max CPA = contribution margin.
- Target CPA = contribution margin − (price × target profit margin).
- CPA = CPC ÷ CVR, and ROAS = revenue ÷ spend.
- LTV = contribution margin × (1 + repeat purchases), and LTV:CAC = LTV ÷ CPA.
Limits and tips
- Cost per click, conversion rate, repeat purchases and the order change with price are assumptions you take from your own campaigns. They are not platform benchmarks, and the sheet promises no figures for your industry.
- The sheet simulates one product at a time at a fixed average, and does not count daily performance swings, collection delays or tax.
- It assumes shipping is paid on every order and that returned goods come back intact. If they are damaged or cost extra shipping, adjust the costs.
- Repeat purchases are counted with no ad cost, so confirm that figure before relying on LTV.
- Break-even ROAS excludes fixed costs, so read it with "break-even orders". Platform interfaces and policies change, so take the numbers from the platform's current dashboard and compare them with your real orders.
- Do not delete a row from the middle of the product list, and write the payment fee as a share of the selling price.
- When scaling spend, raise the budget gradually and watch CPA between steps, and keep ROAS above break-even with a safety margin.
Try it
Open the sheet and try it online, or download it for Excel. It holds 10 products. If you want an app that ties your campaigns to each product's cost and tells you whether every ad makes or loses money, ask for it here.