Many advertisers decide that one ad beats another because its number in the platform dashboard is higher this week. But a higher number does not necessarily mean a real difference; it can be chance on a small number of clicks. The free Ads A/B test log sheet records every test between two versions and works out the difference and its statistical significance, so you know when to trust a result and when to wait for more data.
The problem it solves
When you compare two ads in a platform dashboard the numbers are close and you lean towards the higher one. The sheet asks one question: is the difference in conversion rate per click bigger than chance explains, at the confidence level you chose? And because every test is logged in one place, after a few months you can see which kinds of test (image, headline or landing page) paid off for you and which showed nothing.
Steps from opening the file to the verdict
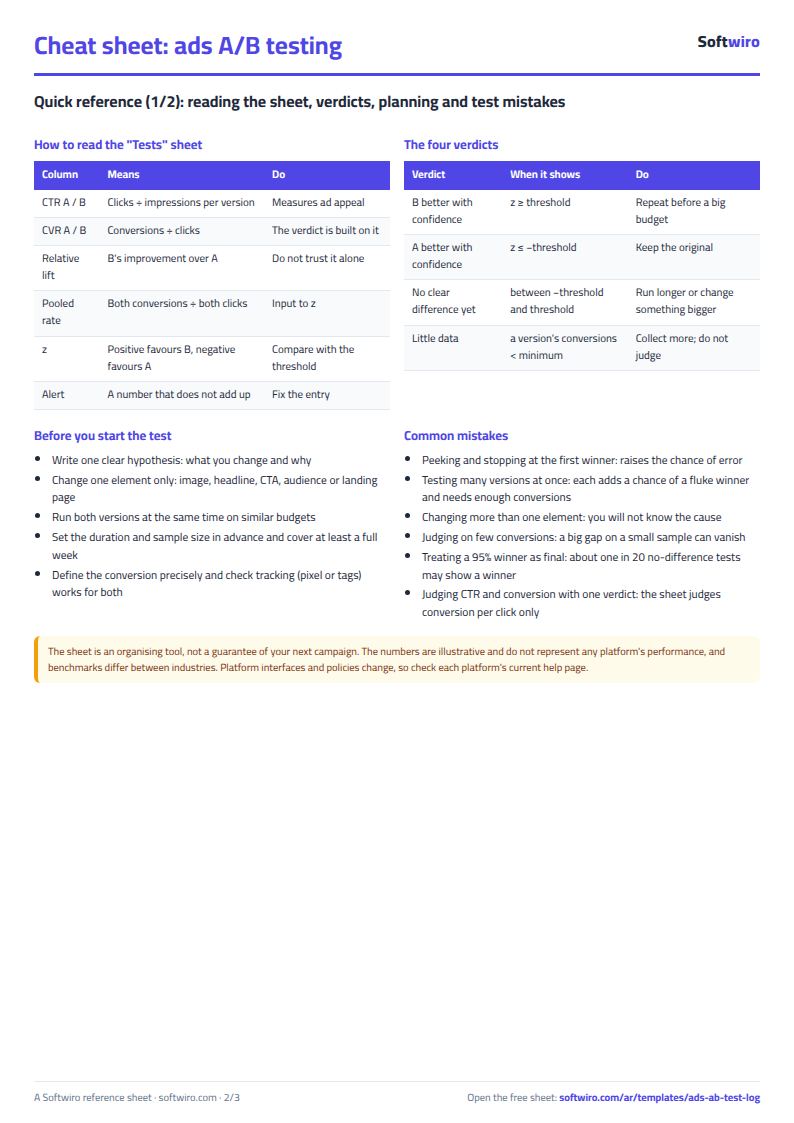
- Settings: choose the confidence level (90, 95 or 99) and the matching z threshold appears; review the minimum conversions per version (30 by default) and edit the test-type and platform lists if you like.
- Tests: log each test in a row: its name, the platform, the type from the list, and the start and end dates.
- For each version (A is the original and B is the new one) enter the impressions, clicks and conversions from the platform dashboard after the test ends.
- Let the grey columns calculate: CTR and CVR for each version, the relative lift, the pooled rate, z and the verdict.
- Read the "Verdict" column: "B better with confidence", "A better with confidence", "no clear difference yet" or "little data", and watch the "Alert" column if you typed a number that does not add up (more clicks than impressions, for example).
- Open Summary for the number of tests, the success rate of the new versions, the average lift of the winners, and two tables by test type and by platform.
Worked example (sample data)
The following figures are sample data for a business called "Example Store", not real performance of any platform. 14 tests were logged at a 95% confidence level (z threshold 1.96) with a minimum of 30 conversions per version:
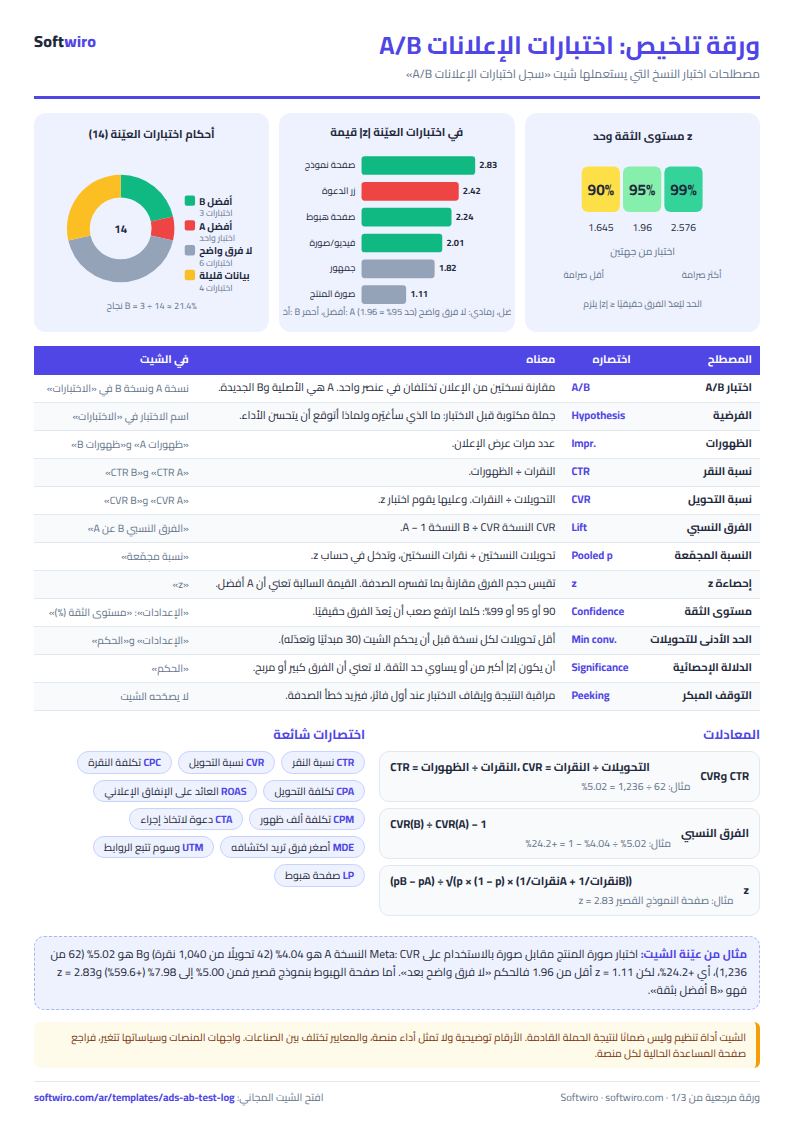
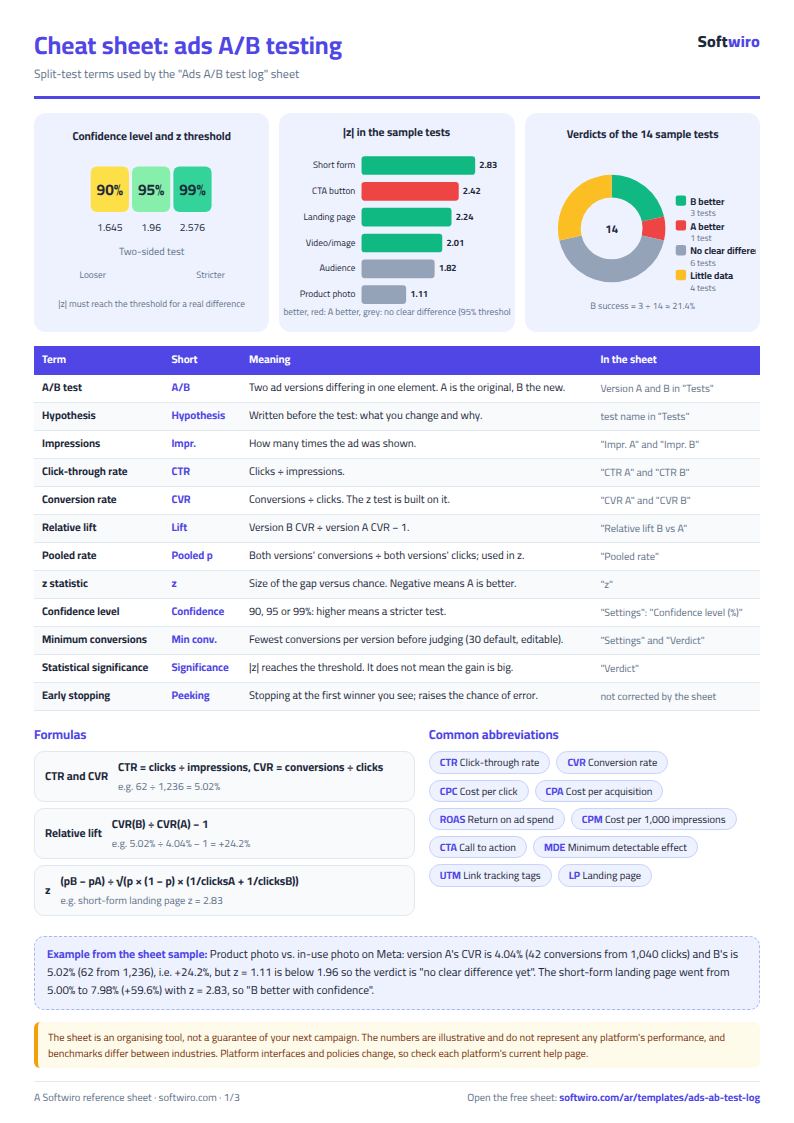
- Product photo vs. in-use photo (Meta): version A's CVR is 4.04% (42 conversions from 1,040 clicks) and B's is 5.02% (62 from 1,236), a relative lift of +24.2%. It looks large, but z = 1.11 is below 1.96, so the verdict is "no clear difference yet".
- "Order now" button vs. "Contact us" (Meta): A at 6.30% (62 from 984) and B at 3.92% (40 from 1,020), with z = −2.42, so the verdict is "A better with confidence". The new version here is weaker than the original.
- Short video vs. static image (TikTok): 2.31% vs. 3.16%, a lift of +36.9% and z = 2.01, so "B better with confidence".
- Old vs. new landing page (Google Ads): 3.97% vs. 5.99%, a lift of +51.0% and z = 2.24, "B better with confidence".
- Landing page with a short vs. long form (Meta): 5.00% vs. 7.98%, a lift of +59.6% and z = 2.83, the strongest result in the sample.
- Headline with brand name vs. without (Google Ads): 15 conversions for A and 21 for B and a relative lift of +30.3%, but the verdict is "little data" because version A is under 30 conversions. The LinkedIn and X tests are the same.
- Summary of the 14 tests: B better with confidence in 3, A better with confidence in 1, no clear difference in 6, and little data in 4. So the success rate of new versions is 21.4% (3 ÷ 14), among decisive tests only 75% (3 ÷ 4), and the average CVR lift of the three winners is 49.2%.
- By type: B versions won both "landing page" tests (2 of 2) and one of 3 "image" tests, and did not win on headlines, text, calls to action or audience in this sample.
How the numbers are worked out
- CTR = clicks ÷ impressions, and CVR = conversions ÷ clicks.
- Relative lift = B's CVR ÷ A's CVR − 1.
- z statistic = (pB − pA) ÷ √(p × (1 − p) × (1/clicksA + 1/clicksB)), where p is the pooled rate (both versions' conversions ÷ both versions' clicks). The difference counts as real when the absolute value of z is at least the confidence threshold: 1.645 at 90%, 1.96 at 95% and 2.576 at 99%.
- Verdict: "little data" comes first if either version has fewer conversions than the minimum; otherwise z is compared with the threshold.
Practical rules for a cleaner test
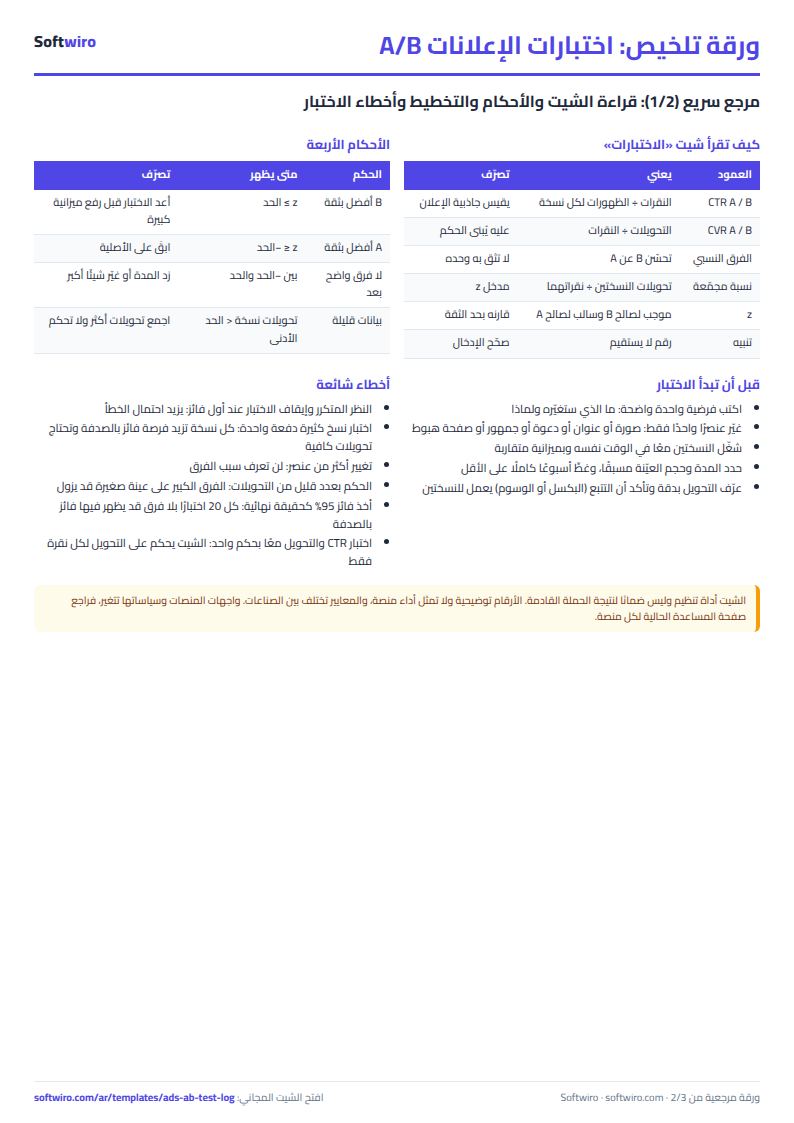
- Start from a written hypothesis: for example "a shorter form will raise the conversion rate because visitors fill it faster". A test without a hypothesis gives you a number without a lesson.
- Change one thing per test: if you change the image and the headline together you will not know which made the difference.
- Decide the sample size and duration before you start: let the test run until each version has enough conversions, and cover at least a full week because buyer behaviour differs between days of the week.
- Do not stop at the first good result: looking at the result repeatedly (peeking) and stopping when a winner appears raises the chance of error a lot. Log the numbers after the period you set has ended.
- Do not test many versions at once: every extra version raises the chance that a winner appears by chance, and each needs enough conversions; the sheet is built for two versions only.
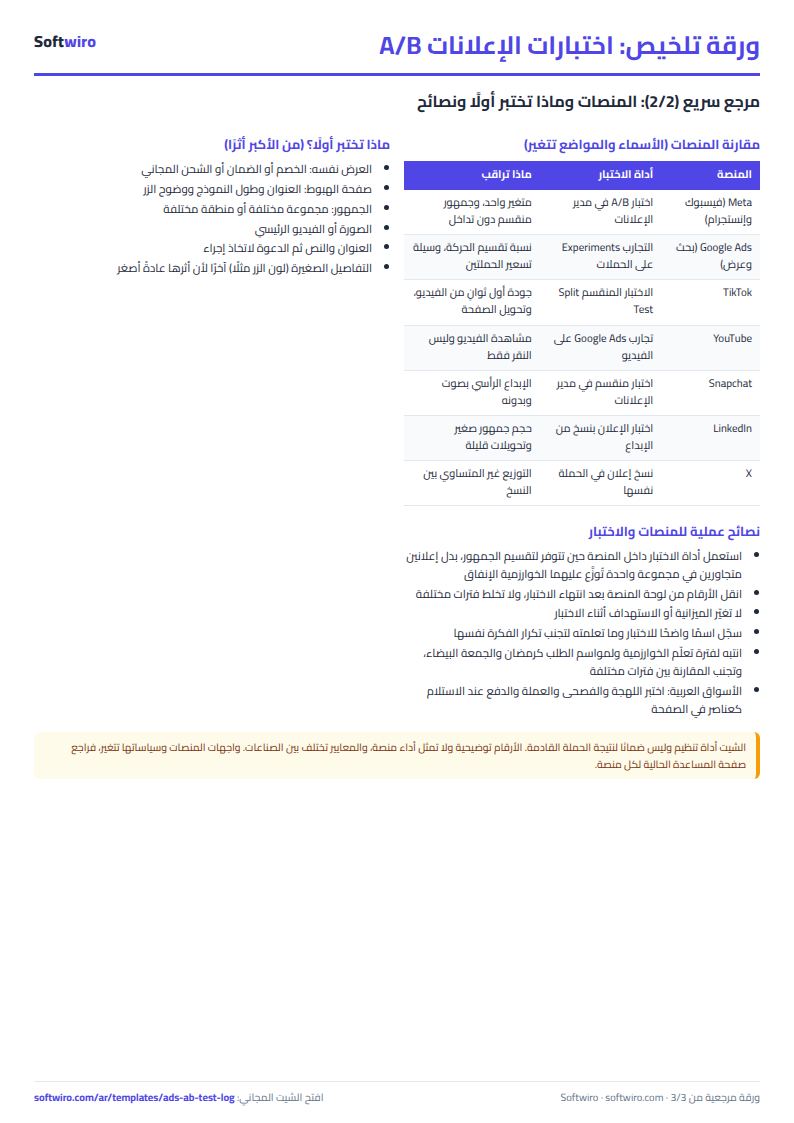
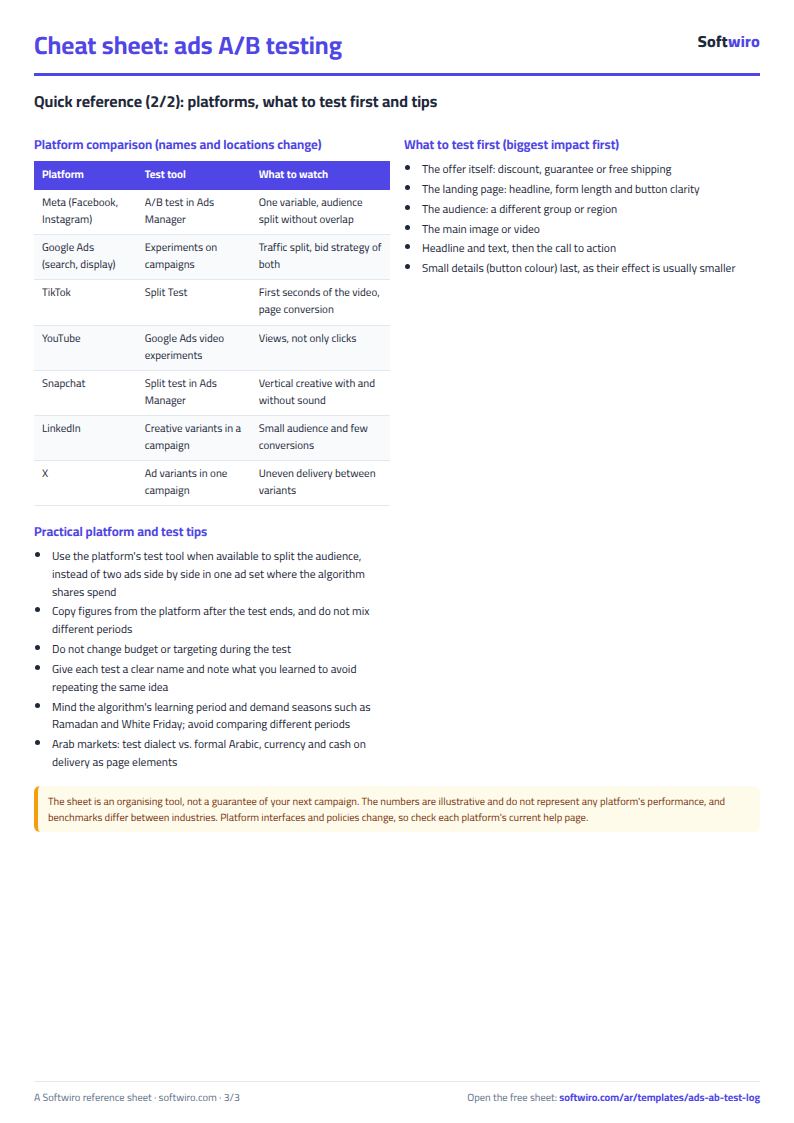
- What to test first: start with what is likely to matter most: the offer, the landing page, the audience or the main image, then the headline and text, and last small details such as button colour.
Platform notes
The testing tools inside the platforms split the audience or the traffic between the versions so that they do not compete for the same people. This is better than running two ads side by side in one campaign and letting the algorithm share the spend between them:
- Meta (Facebook and Instagram): Ads Manager has an A/B test tool that splits the audience and compares two versions on one variable.
- Google Ads: Experiments let you split a campaign's traffic between the original campaign and a modified copy.
- TikTok: Ads Manager has a Split Test to compare one variable.
The names, locations and conditions of these tools change, so check the platform's current help page. The audience may be split differently on other platforms such as Snapchat, LinkedIn, YouTube and X, so check that both versions run at the same time and on similar budgets.
Limits of the sheet
- The sheet tests conversion rate per click only; it does not test CTR, ROAS or order value.
- The calculation assumes a large enough sample and does not correct for comparing many versions or for stopping early.
- If you log many tests at 95% expect some to look like winners by chance alone. Repeat the test before building a large budget on one result.
- The minimum conversions (30) is an editable default, not a fixed rule, and benchmarks differ between industries and platforms; the sheet promises none of them.
- The sheet holds 200 tests with two versions (A and B) only, and it does not pull numbers from the platforms; you copy them in by hand.
Try it
Open the sheet and try it online, or download it for Excel. It holds 200 tests. If you want an app that collects your test numbers from the platforms and produces ready reports, ask for it here.