Anyone running ads on more than one platform asks the same question: how much on Meta, how much on Google, and are TikTok and LinkedIn worth what I spend on them? The free ad budget media plan sheet answers that before you spend: you split the budget across campaigns and write your assumptions, and the sheet projects impressions, clicks, conversions, cost per conversion (CPA), revenue, ROAS and profit after ad spend, then compares three scenarios.
The problem it solves
Many people split the budget by habit or by what everyone did last month, and then do not know whether the campaign that took a fifth of the budget even pays for itself. Here all the arithmetic sits in one file: each campaign's share, what it is expected to deliver, and whether it is above or below break-even, against a ROAS target you set.
Steps from opening the file to a decision
- Settings: enter the business name, the month, the total budget, the average order value, the gross margin and your ROAS target.
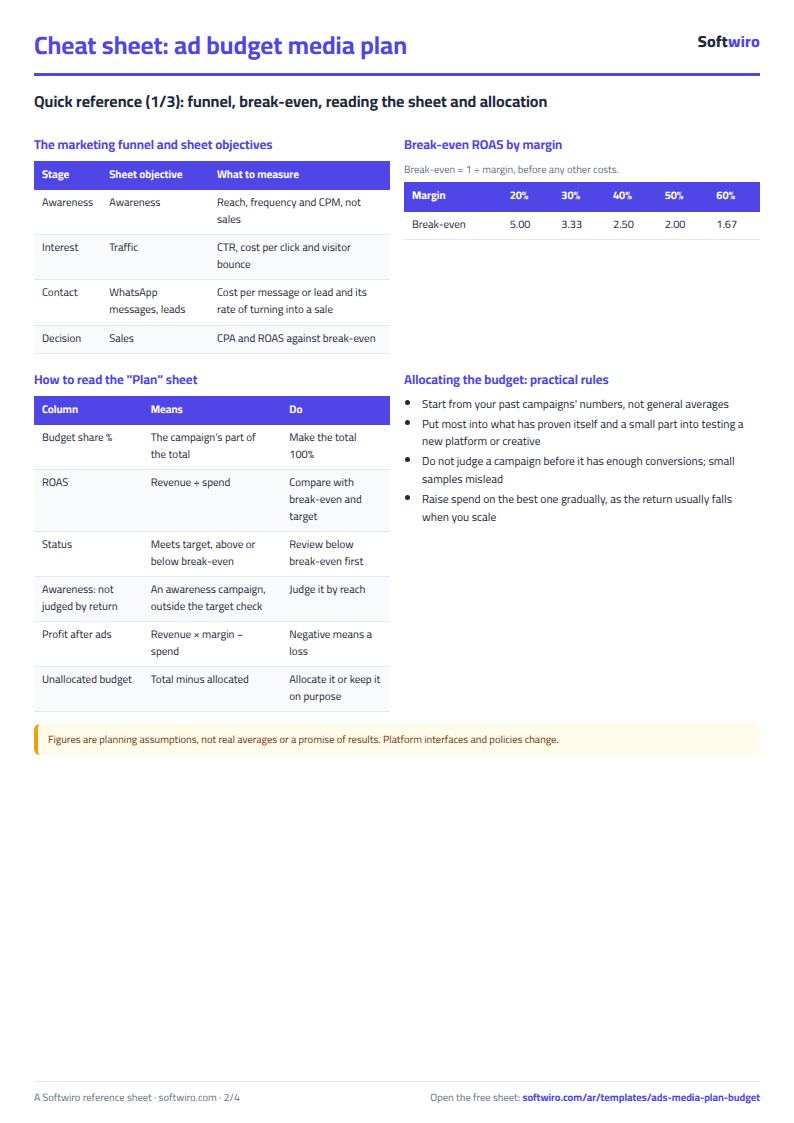
- Plan: write each campaign in a row (up to 12): pick the platform and the objective from the list, then its share of the budget.
- For each campaign enter your assumptions: cost per thousand impressions (CPM), click-through rate (CTR) and conversion rate (CVR). Start from your past campaigns' numbers in each platform's dashboard.
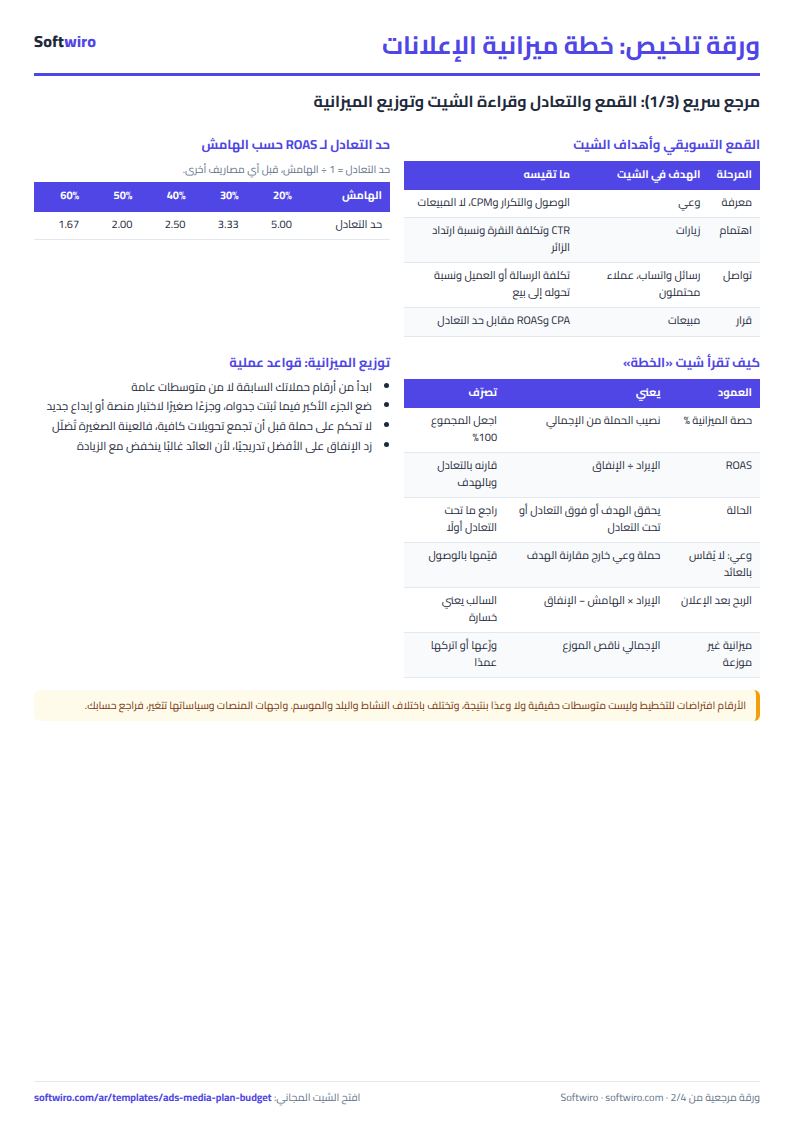
- Check the total and the share warning: the shares must add up to 100%. For every campaign the sheet works out budget, impressions, clicks, conversions, CPA, revenue, ROAS, profit and status.
- Comparison: set the increase for the best campaign and the cut for the weakest, to compare spend, revenue and profit across the three scenarios.
- When the month ends, replace the assumptions with actual performance from the platforms and re-estimate the next month.
Worked example (sample data)
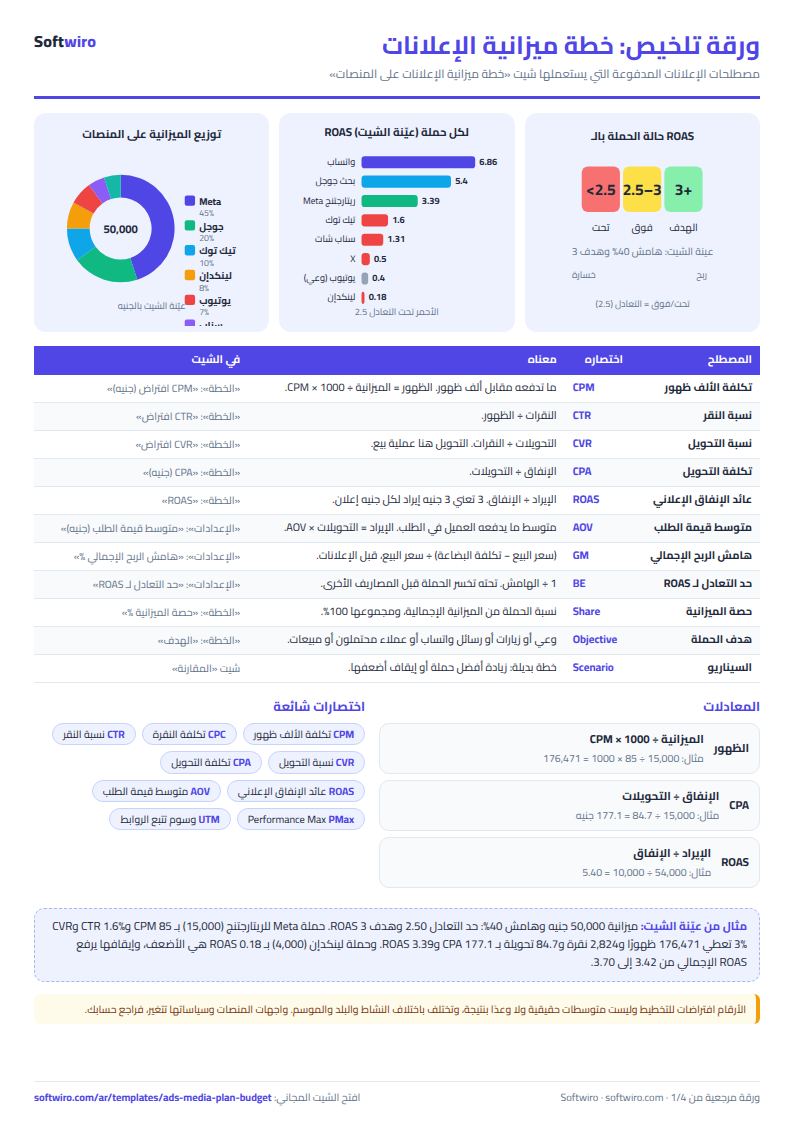
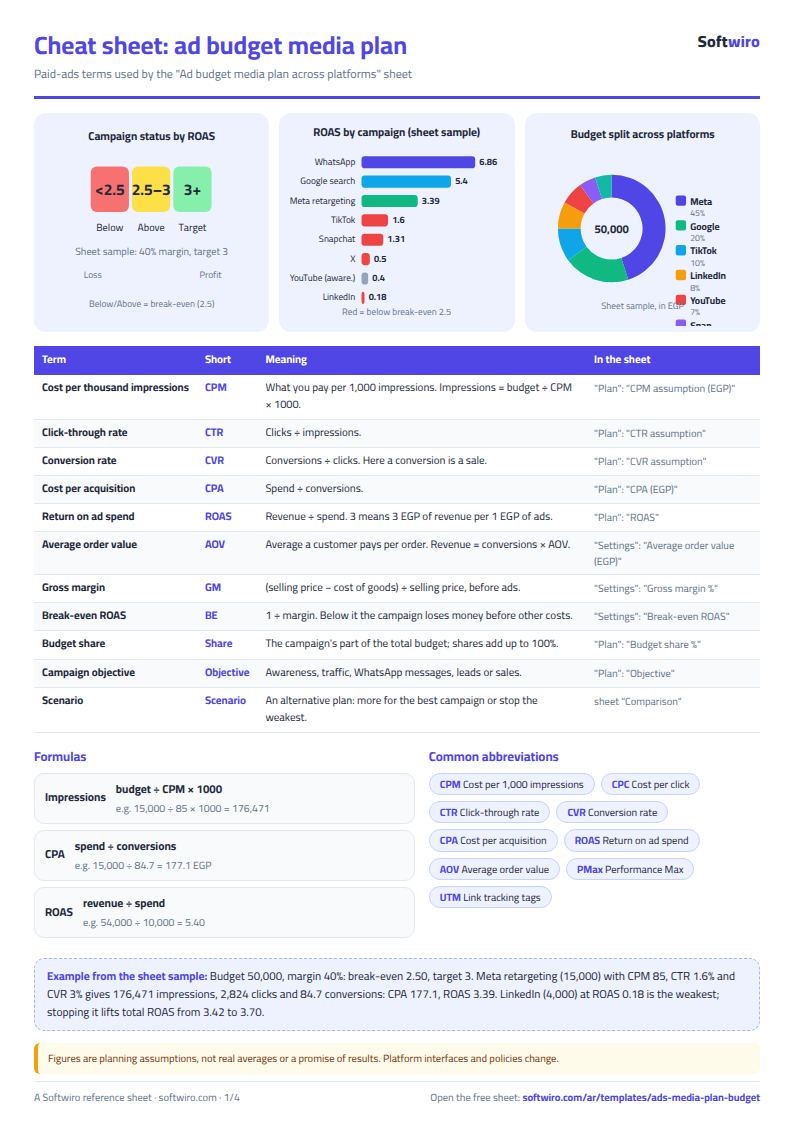
The figures are sample data for an example fashion store in November 2026: a budget of 50,000 EGP, an average order value of 600 EGP, a gross margin of 40% and a ROAS target of 3.0. Break-even is therefore 1 ÷ 0.40 = 2.50. Every CPM, CTR and CVR in it is an illustrative assumption, not a real average for any platform.
- Meta, retargeting sales (30%): 15,000 EGP, 176,471 impressions, 2,824 clicks and 84.7 conversions, CPA = 177.1 EGP, revenue 50,824, ROAS 3.39, profit after ads 5,329, status "Meets target".
- Meta, WhatsApp messages (15%): 7,500 EGP, 85.7 conversions at CPA = 87.5 EGP, revenue 51,429, ROAS 6.86 and profit 13,071. It is the best campaign in the sample.
- Google Ads, search (20%): 10,000 EGP, 90 conversions at CPA = 111.1 EGP, revenue 54,000, ROAS 5.40 and profit 11,600.
- TikTok (10%): 5,000 EGP, ROAS 1.60 and profit −1,800, status "Below break-even" because it is under 2.50.
- Snapchat (5%): ROAS 1.31 and profit −1,191, and X (5%): ROAS 0.50 and profit −2,000; both are below break-even.
- YouTube (7%): an awareness campaign with the status "Awareness: not judged by return", so it is not compared with the ROAS target but still counts in the totals.
- LinkedIn (8%): 4,000 EGP, 60 clicks and 1.2 conversions, CPA = 3,333.3 EGP, ROAS 0.18 and profit −3,712. It is the weakest campaign in the sample.
- Total: 648,512 impressions, 9,176 clicks and 284.8 conversions, CPA = 175.5 EGP, revenue 170,895, ROAS 3.42 and profit after ads 18,358, so it shows "Meets target".
- Scenario 2 (20% more for the best campaign, i.e. 1,500 EGP extra for WhatsApp messages): spend 51,500, ROAS 3.52 and profit 20,972, which is +2,614 on the current plan.
- Scenario 3 (stop LinkedIn): spend 46,000, ROAS 3.70, CPA = 162.2 EGP and profit 22,070, which is +3,712 on the current plan. The 4,000 saved is not reallocated.
Note that the LinkedIn campaign in the sample targets business customers with an average order of 600 EGP, while the value of a lead in your business may be very different. The numbers show how to read the sheet; they are not a verdict on a platform.
How the numbers are worked out
- Budget = share × total budget. Impressions = budget ÷ CPM × 1000.
- Clicks = impressions × CTR. Conversions = clicks × CVR. CPA = spend ÷ conversions.
- Revenue = conversions × average order value. ROAS = revenue ÷ spend.
- Profit after ads = revenue × margin − spend. Break-even ROAS = 1 ÷ margin.
- A conversion here means a sale. For message and lead campaigns, enter in CVR the share of messages or leads that turn into an actual sale.
Which platform suits which goal
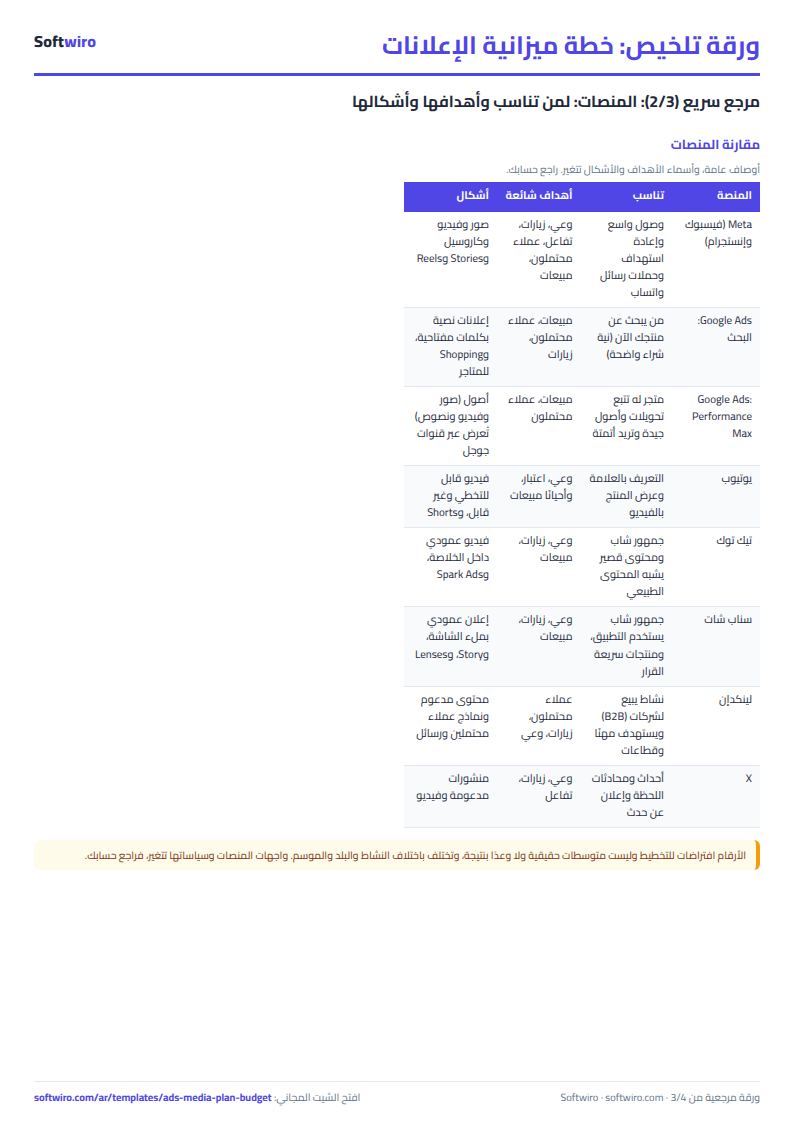
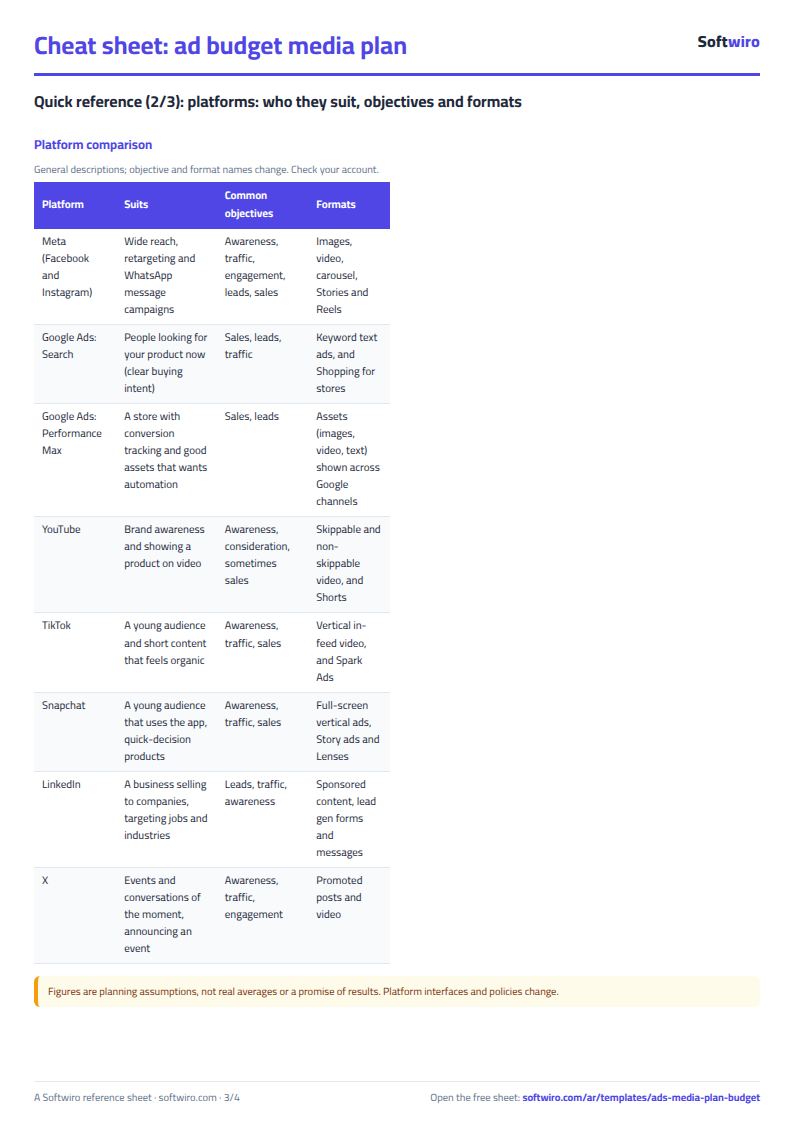
No platform is better than the others in every case. They differ in audience and ad formats, and general descriptions like these change over time:
- Meta (Facebook and Instagram): wide reach, retargeting and click-to-WhatsApp message campaigns.
- Google Ads: search that catches people looking for your product now, Performance Max, and YouTube for video.
- TikTok and Snapchat: short vertical video for a younger audience, so check the audience size in your country.
- LinkedIn: targeting by job and company for a business that sells to companies.
- X: events and conversations of the moment.
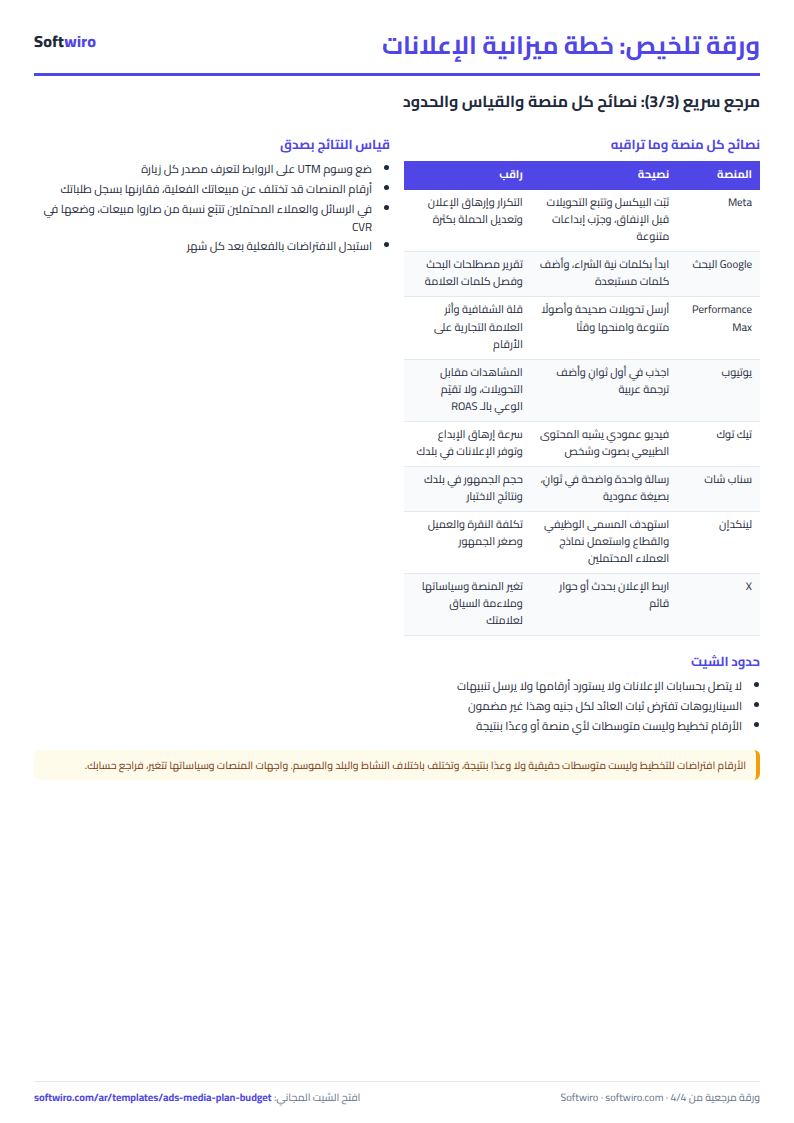
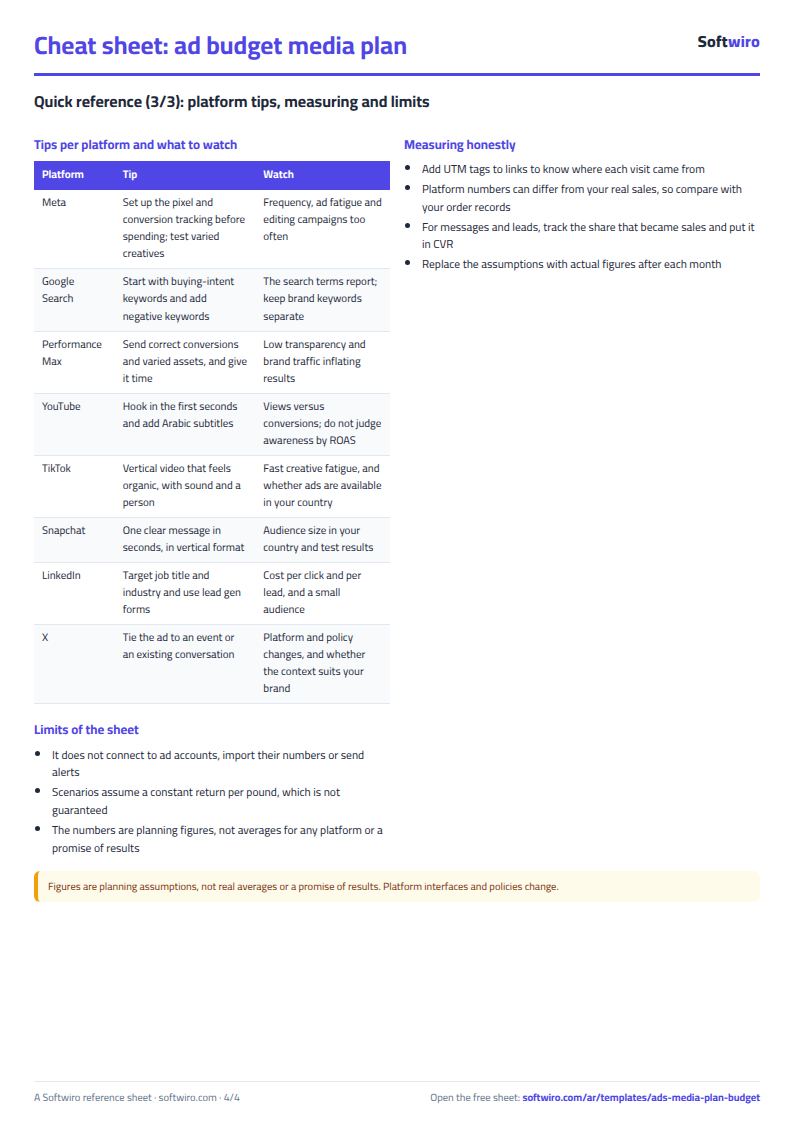
The free cheat sheet on the sheet's page has the platform table, tips for each platform and what to watch.
Limits and tips
- Every CPM, CTR and CVR in the sample is an assumption, not a real average, and real figures vary by industry, country, season and creative. Your own campaigns' numbers are the base.
- The "Comparison" scenarios assume a constant return per pound, which is not guaranteed: spending more on a platform usually raises costs and lowers the return. The sheet is a planning estimate, not a promise of results.
- Awareness campaigns are judged by reach and frequency, not direct sales, and the ROAS the sheet shows rests on the conversion rate you enter, not on platform tracking.
- Platform interfaces and policies change, so check objective and format names in your own account before relying on what is written here.
- The sheet does not connect to ad accounts or import their numbers, and it sends no alerts. Reallocating the budget is a decision you make.
Try it
Open the sheet and try it online, or download it for Excel. It holds 12 campaigns across 7 platforms. If you want a program that imports the platforms' numbers and sends alerts, ask for it here.