You run campaigns on more than one platform and every dashboard shows numbers its own way: one counts clicks one way, another a different way, and at the end of the week you cannot tell which campaign is earning and which is draining your budget. The free ad campaign performance tracker gathers your campaigns into one log, works out CTR, CPC, CPM, conversion rate, cost per conversion and ROAS, and compares them with your own targets.
The problem it solves
Each platform's dashboard shows its own numbers, with its own names and attribution periods, and not the full picture: how much you spent across all platforms this week, what one order costs overall, and whether the campaign that looks successful on its dashboard really makes a profit. Here you enter the numbers once a day in one format, so you can compare campaigns, platforms and weeks with each other.
Steps from opening the file to the report
- Settings: your business name, today's date and your three targets (the highest cost per conversion CPA you accept, the lowest ROAS and the lowest CTR), then the platforms you advertise on (up to 7) and your campaigns (up to 20).
- Daily log: log a row for each campaign each day: the date, platform and campaign from the two lists, then spend, impressions, clicks, conversions and revenue as you read them from the platform's dashboard.
- For every row the sheet works out CTR, CPC, CPM, conversion rate, CPA and ROAS, writes a "Performance alert" if the row is outside your targets, and a "Data alert" if the date is missing, the platform or campaign is not registered, or clicks exceed impressions.
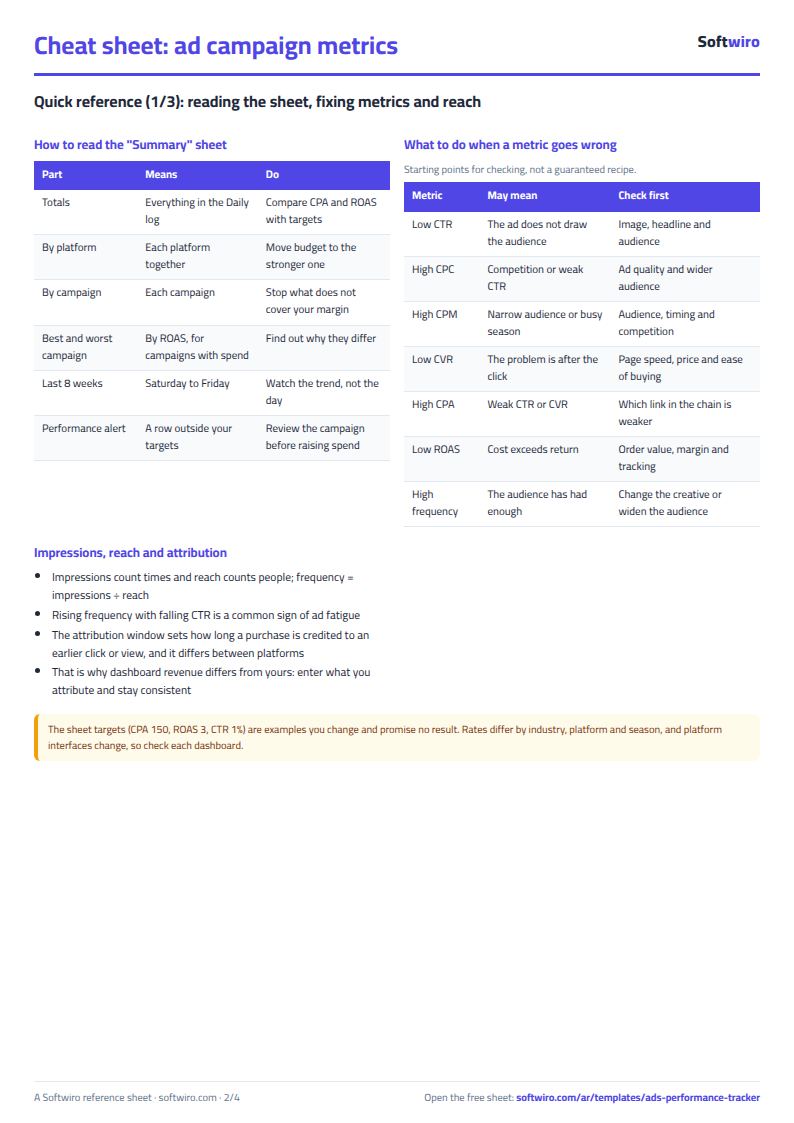
- Open Summary for the totals, a table per platform and a table per campaign, the number of alerts, and the best and worst campaign by ROAS.
- At the bottom of Summary are the last 8 weeks (a week starts on Saturday) with the change in spend, revenue, conversions, CPA and ROAS on the previous week. Update today's date in Settings and the weeks move with it.
Worked example (sample data)
The name and figures are sample data for a household-goods shop. 292 rows were logged from 12 September to 13 November 2026 across 7 platforms and 9 campaigns, with targets of CPA no higher than 150 pounds, ROAS no lower than 3 and CTR no lower than 1%:
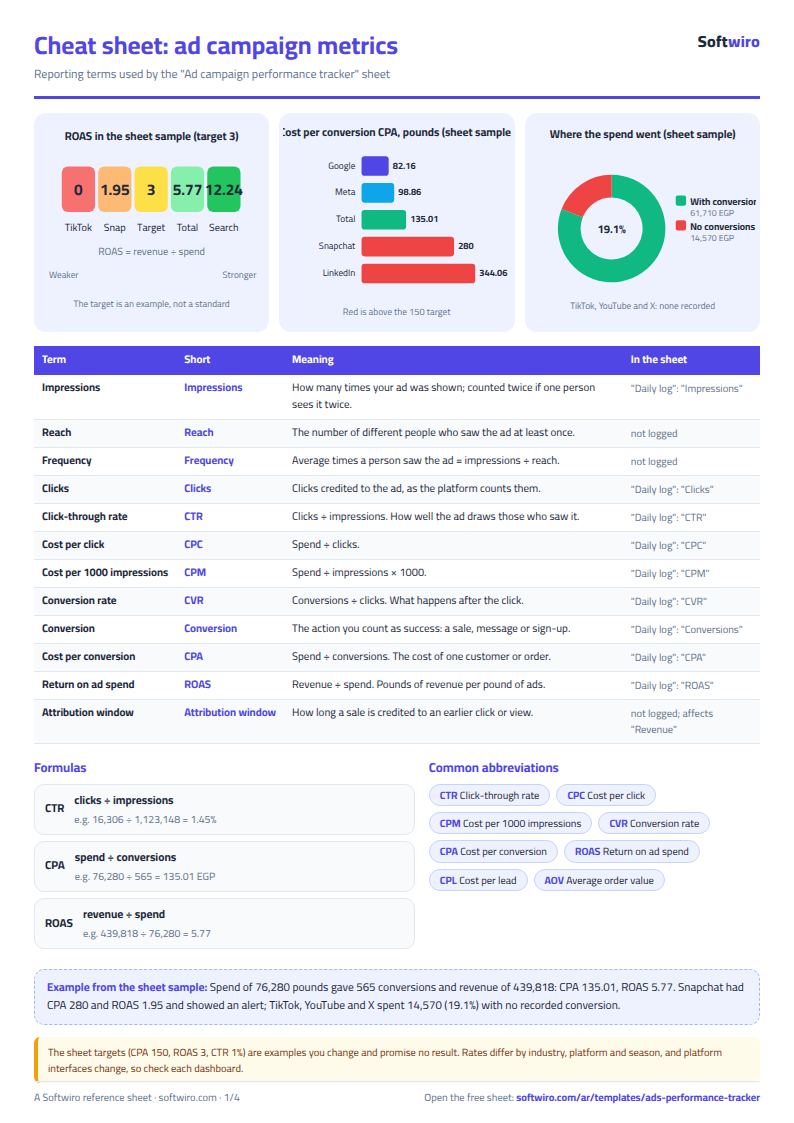
- Total: spend 76,280 pounds, revenue 439,818 (a difference of 363,538), 1,123,148 impressions, 16,306 clicks and 565 conversions. So CTR 1.45%, CPC 4.68, CPM 67.92, conversion rate 3.46%, CPA 135.01 and ROAS 5.77.
- Google: spend 23,170, CPA 82.16 and ROAS 8.77. The campaign "Search - product names" is the best: ROAS 12.24 on spend of 12,540.
- Meta: spend 23,330, CPA 98.86 and ROAS 6.40.
- LinkedIn: high CPM (251.03), CPC 40.48 and CPA 344.06, above target, yet ROAS 7.18 because each order is of high value. The alert appears on CPA alone, and whether the deal is worth the cost is your call.
- Snapchat: spend 4,200, CPA 280 and ROAS 1.95, so it shows both the CPA and ROAS alerts.
- TikTok, YouTube and X: spend of 7,230, 5,730 and 1,610 with no recorded conversion or revenue, which is 14,570 pounds (19.1% of spend). The worst campaign is "TikTok - awareness videos" with ROAS zero. They may be awareness campaigns meant for reach, not sales, or tracking may not be set up; the decision is yours.
- Alerts on Summary: 5 platforms above the CPA target and 4 below the ROAS target; 6 campaigns above the CPA target, 4 below the ROAS target and 5 below the CTR floor.
- The week: the week of 7 November had spend of 8,720, 63 conversions, CPA 138.41 and ROAS 5.41. The week before had 8,740, 61 conversions, CPA 143.28 and ROAS 5.29, so CPA improved by 3.4% and ROAS rose 2.1%.
- One row: the first row in the sheet (LinkedIn, 12 September): spend 310, 1,178 impressions, 7 clicks, one conversion and revenue of 2,691, so CTR 0.59%, CPC 44.29, CPM 263.16, conversion rate 14.29%, CPA 310 and ROAS 8.68, and "CPA above target" shows. Be careful drawing conclusions from a row with a single conversion.
How the numbers are worked out
- CTR = clicks ÷ impressions. CPC = spend ÷ clicks. CPM = spend ÷ impressions × 1000.
- Conversion rate CVR = conversions ÷ clicks. CPA = spend ÷ conversions. ROAS = revenue ÷ spend.
- In the tables and Summary the raw numbers (spend, clicks...) are added up first and the ratios are then worked out from the totals, not by averaging row ratios.
- Change in CPA and ROAS compares the week's ratio with the previous week's ratio, and shows when the previous week has spend and conversions.
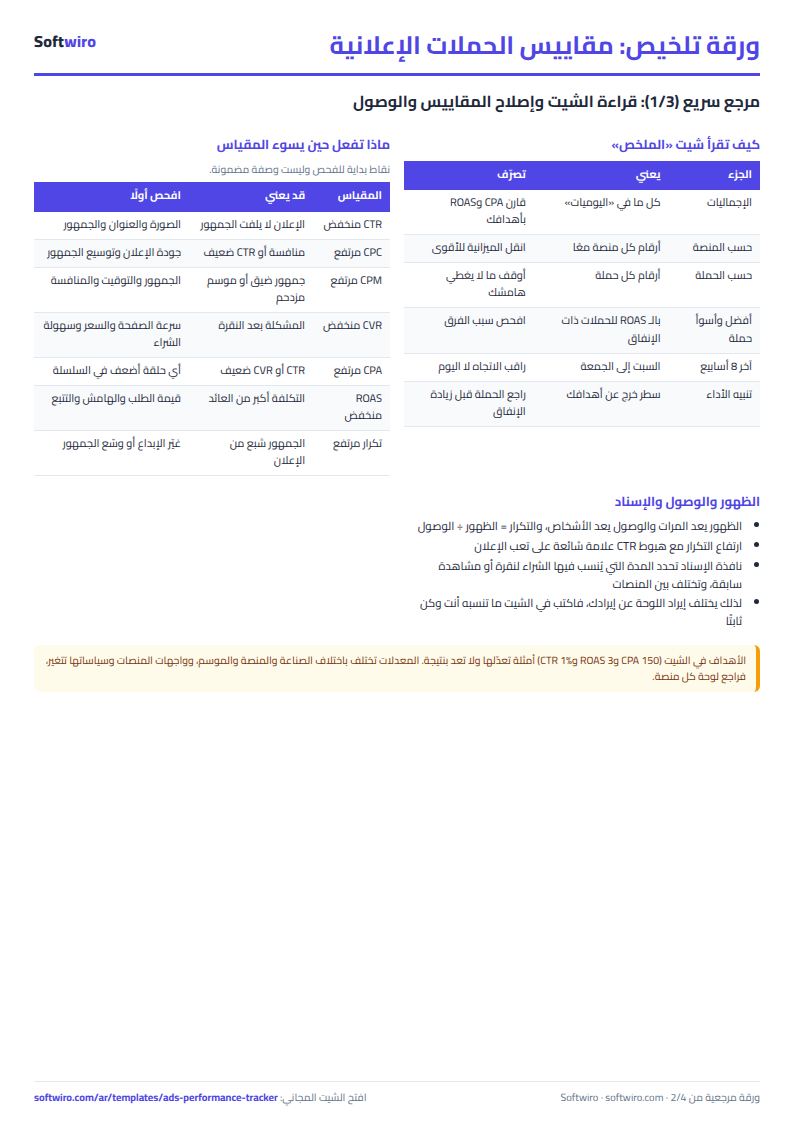
What to do when each metric goes wrong
- Low CTR: review the creative (image and headline), the audience and how well the message fits it. Do not compare CTR across different networks; search is not video.
- High CPC or CPM: the audience is narrow, competition is strong or the season is crowded. Try widening the audience and improving ad quality.
- Low CVR: the problem is usually after the click: page speed, ease of buying, a clear price, and an offer that matches the ad.
- High CPA or low ROAS: check which link in the chain is weak (CTR or CVR), stop or cut spend on what does not cover your margin, and move budget to what earns.
Limits and tips
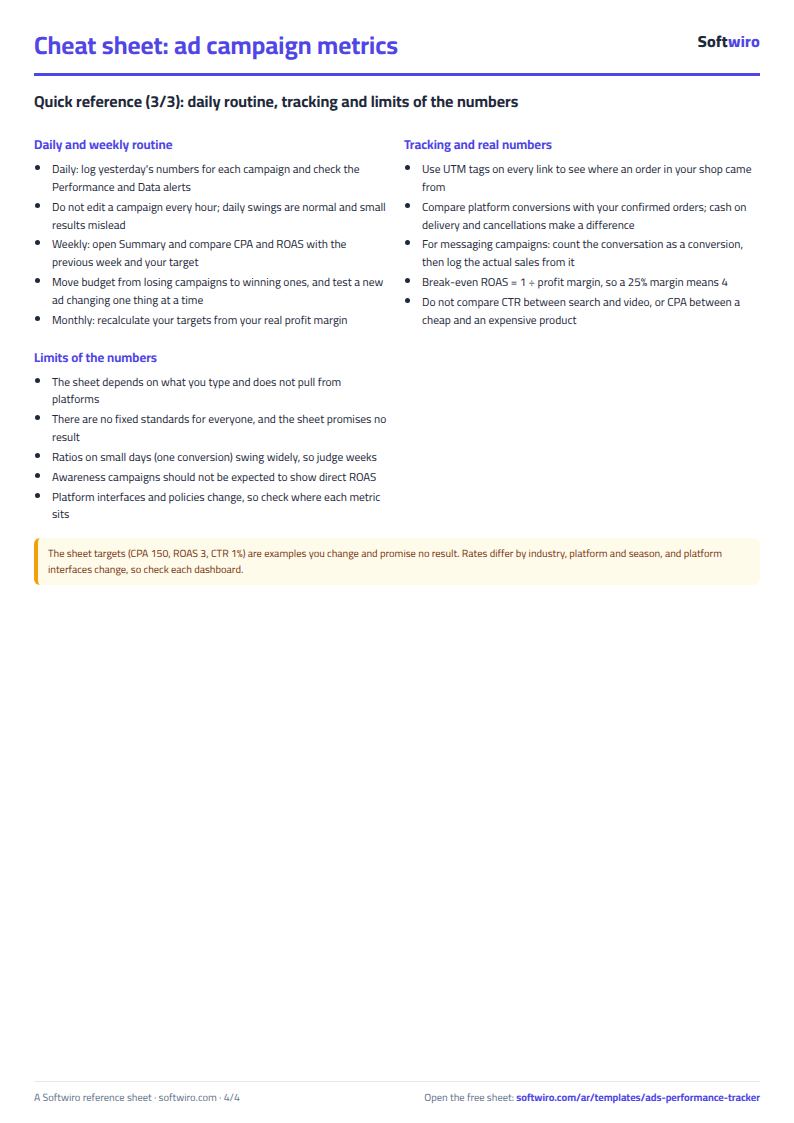
- The CPA, ROAS and CTR targets in the sheet are examples you can change, not standards of any platform. Rates differ by industry, platform and season, and the sheet promises no result. Work out your targets from your profit margin.
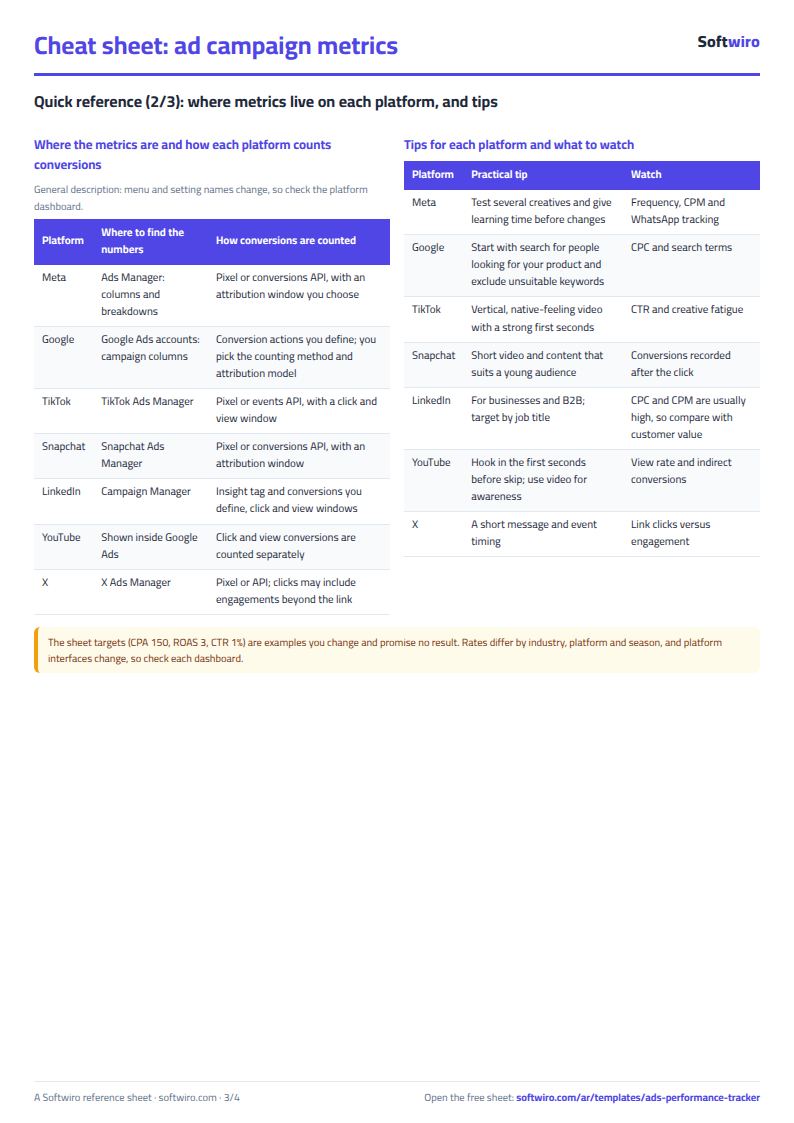
- Revenue is what you attribute to the campaign, and it may differ from the dashboard figure depending on the attribution window and the platform's definition of a conversion. Platform interfaces and policies change, so check where each metric sits on its dashboard.
- The sheet does not pull numbers from the platforms, does not work out attribution between platforms, and sends no alerts outside itself. Do not delete a row from the middle of the platform and campaign lists.
- A campaign or platform not registered in Settings enters the totals and shows in the "not registered" row under the table. If the current week is not over, compare it with the previous one carefully.
- Ratios on small numbers (such as a day with one conversion) swing widely, so judge weeks and totals before single rows.
Try it
Open the sheet and try it online, or download it for Excel. It holds 1500 daily rows, 7 platforms and 20 campaigns. If you want a direct link to your ad accounts, client reports and WhatsApp alerts, ask for it here.