You run ad campaigns for several clients, with their spend and results in one file, your fees in another and your hours in your head? At month end you gather numbers to write the client report and still do not know whether you really earned from this client or whether it eats your time. The free ad agency client management and reports sheet records spend, results and hours for each client and platform, works out your fee, ROAS and margin, and shows a report card for each client.
The problem it solves
Small agencies and freelance media buyers win or lose on a detail that often gets lost: the fee follows a formula (a retainer plus a percentage of spend), but the real cost is your time. A client with small spend and many requests can take more hours than the fee covers. Without regular logging you only see this months later. Here you enter the numbers once and both the report and the margin come out of them.
Steps from opening the file to the report
- Settings: enter the agency name, the year, the report month, your internal hourly cost, the low-margin threshold and the ROAS target.
- Clients: list your clients (up to 15) with the monthly retainer, the fee percentage of spend and the minimum fee, and write "Yes" in "In report" for those who should get a card (up to 6).
- Month: for each client and platform enter the date, the client and the platform from the list, the spend you managed, the recorded revenue or result and your hours.
- Leave the grey columns alone: fee, ROAS, internal cost and margin. The fee and margin appear on the client's first row in the month.
- Open Report to see each selected client's card, the agency totals, the best client by margin and the clients below the threshold.
Worked example (sample data)
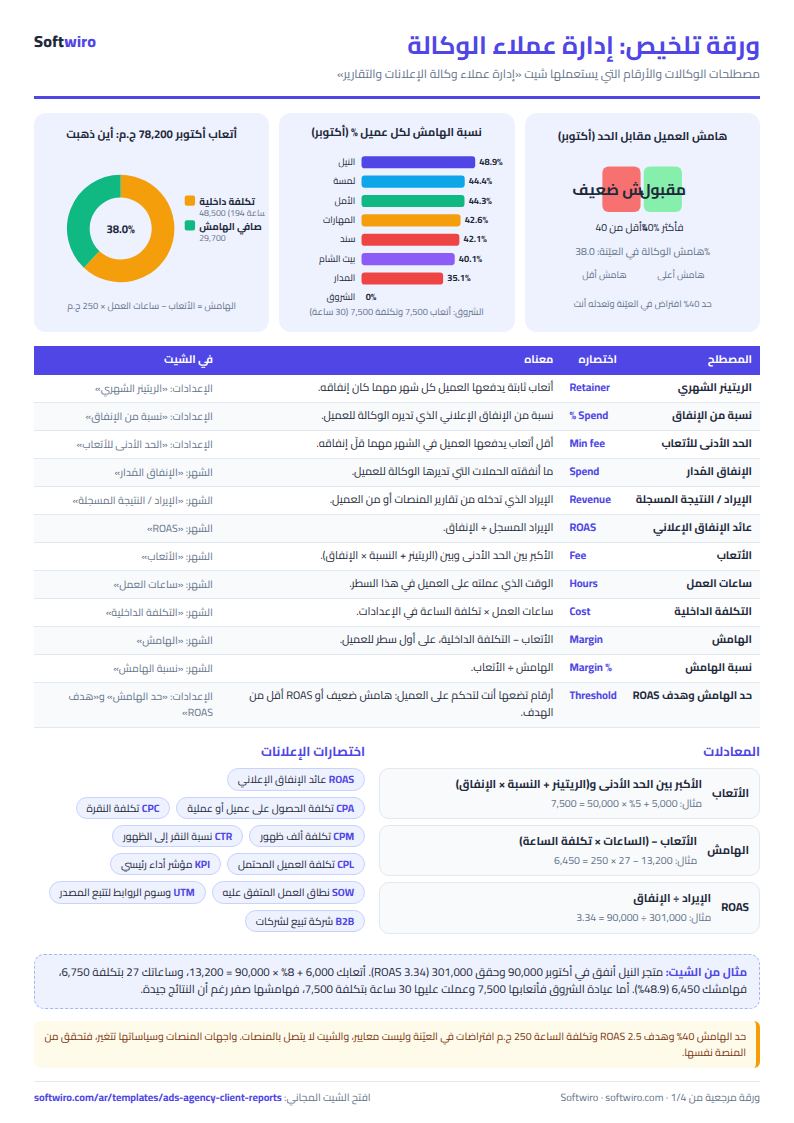
The names and figures are sample data for an example agency; the report month is October 2026, the hourly cost is EGP 250, the margin threshold is 40% and the ROAS target is 2.5. 20 rows were logged in the month for 8 clients:
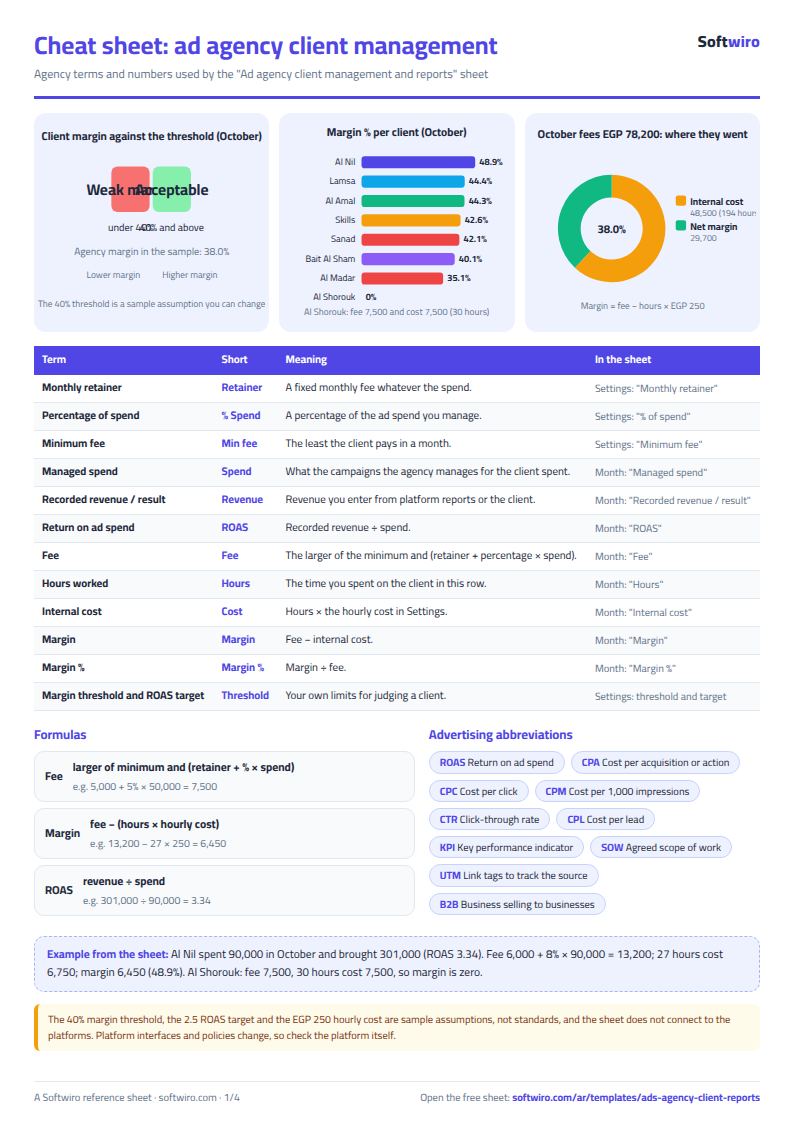
- Agency totals: managed spend EGP 508,000 and recorded revenue 1,406,000, a ROAS of 2.77. Fees 78,200 and internal cost 48,500 (194 hours), so the net margin is 29,700, or 38.0%.
- Al Nil Clothing Store: spend 90,000 and ROAS 3.34. Fee = 6,000 + 8% × 90,000 = 13,200, cost 6,750 (27 hours), margin 6,450, or 48.9%. It is the best client by margin, with the status "Good".
- Al Shorouk Dental Clinic: spend 50,000 and fee = 5,000 + 5% × 50,000 = 7,500. But the work took 30 hours (cost 7,500), so the margin is zero and the status is "Weak margin". In September its hours were 21 and its margin 2,150 (29.1%).
- Al Madar Real Estate: spend 139,000 and a ROAS of 2.85, above target; the fee is 17,340 and the cost 11,250 (45 hours), so the margin is 6,090, or 35.1%, and it shows "Weak margin". A good ROAS does not mean a good margin for you.
- Sanad Contracting: a 42.1% margin but a ROAS of 2.2, below target, so it shows "ROAS below target".
- Clients below the margin threshold: 2 of 8 (Al Shorouk and Al Madar).
- Unclassified spend: zero. A client whose name is typed outside the Settings list appears on this line and gets no fee.
How the numbers are worked out
- Fee = the larger of the minimum and (retainer + percentage × the client's total spend in the month across all platforms). It is counted once per client per month.
- Internal cost = hours × hourly cost. Margin = fee − internal cost. Margin % = margin ÷ fee.
- ROAS = recorded revenue ÷ spend.
On agency pricing and the client report
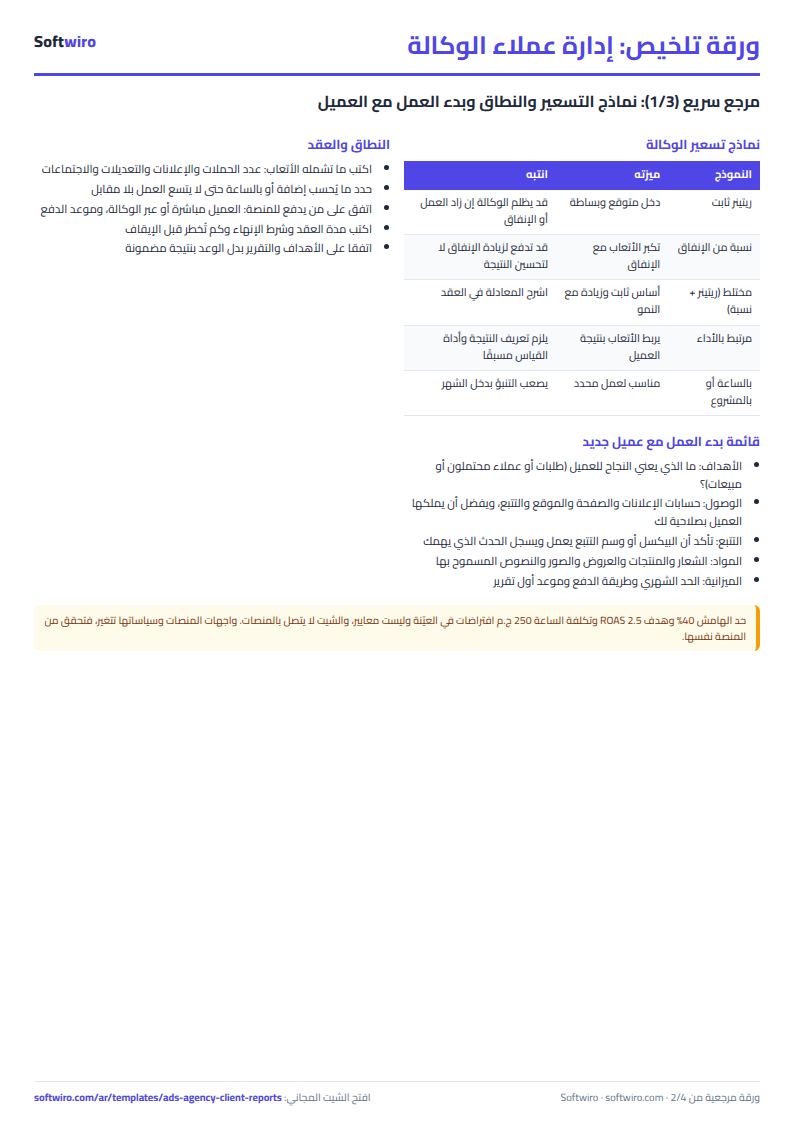
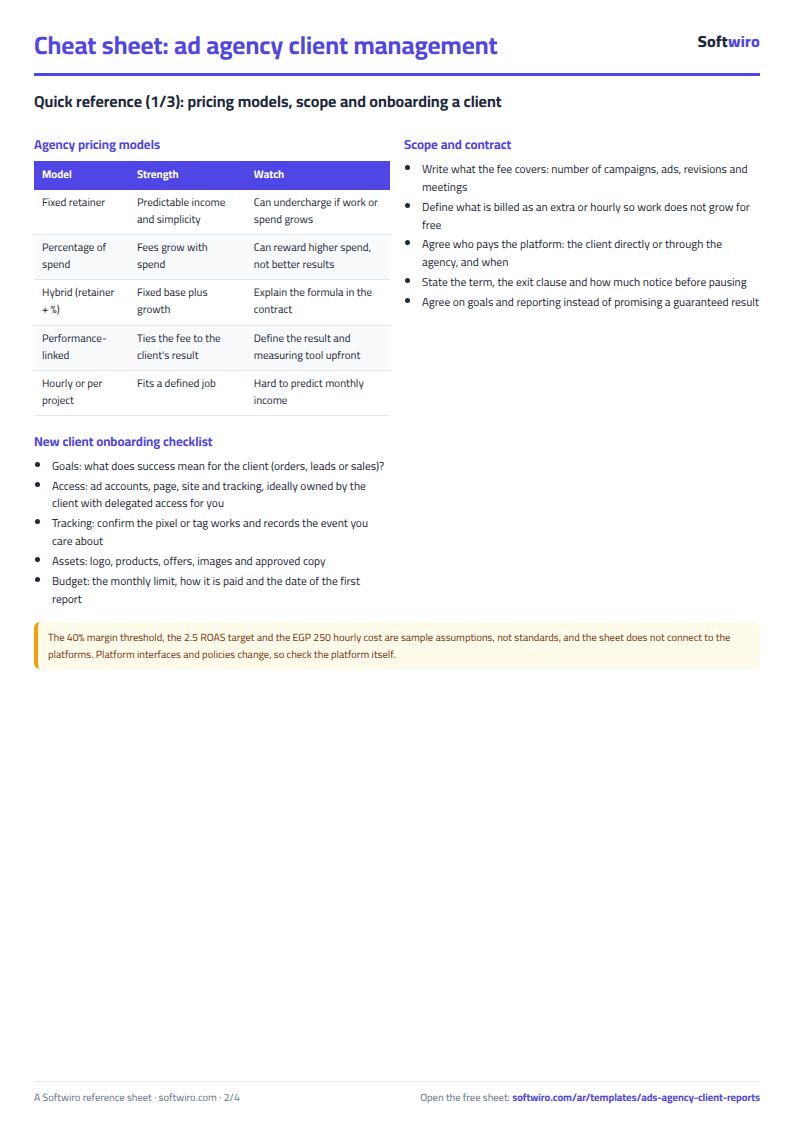
- Common pricing models: a fixed retainer, a percentage of spend, a hybrid, and performance-linked fees. Performance needs a clear agreement on what counts as a result and the tool that measures it. The choice is yours and your client's; the sheet shows its effect on your margin.
- Define the scope in the contract: what the fee covers (number of campaigns, creatives, revisions, meetings) and what is billed hourly or as an extra, so the service does not grow for free.
- Account ownership: it is better for the client to own their ad accounts while you work on them with delegated access, so their accounts and data stay with them if the engagement ends.
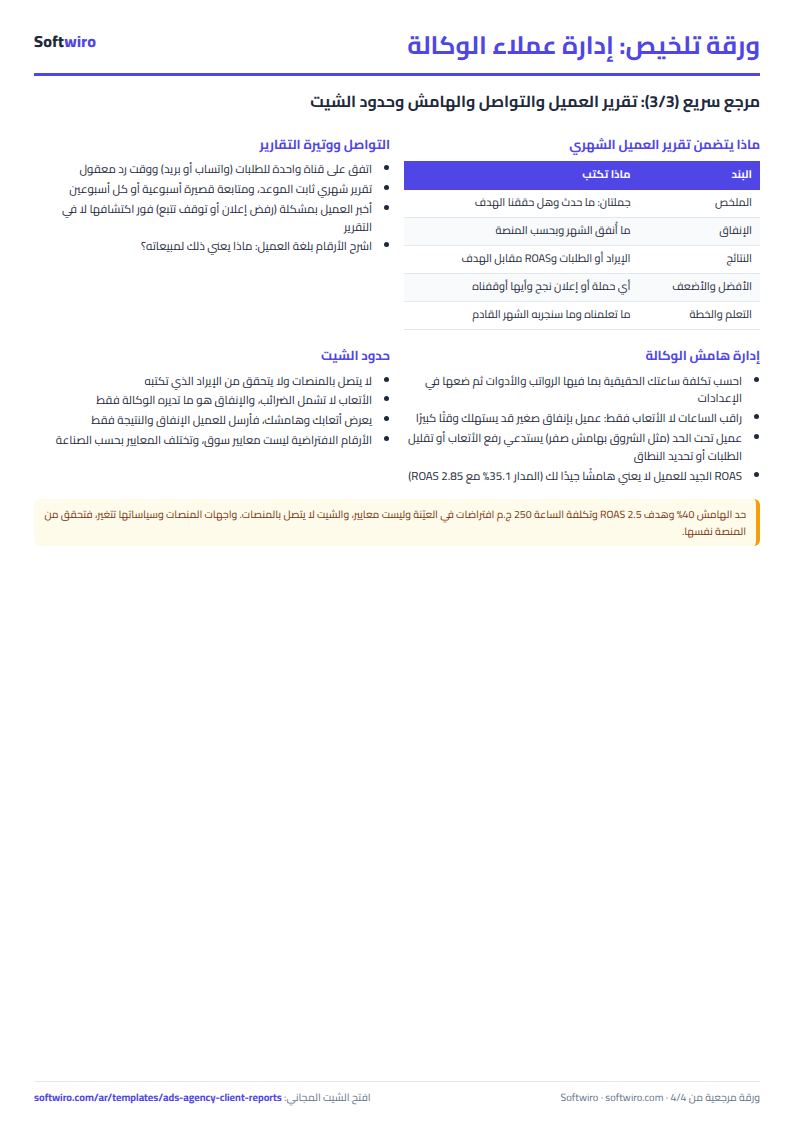
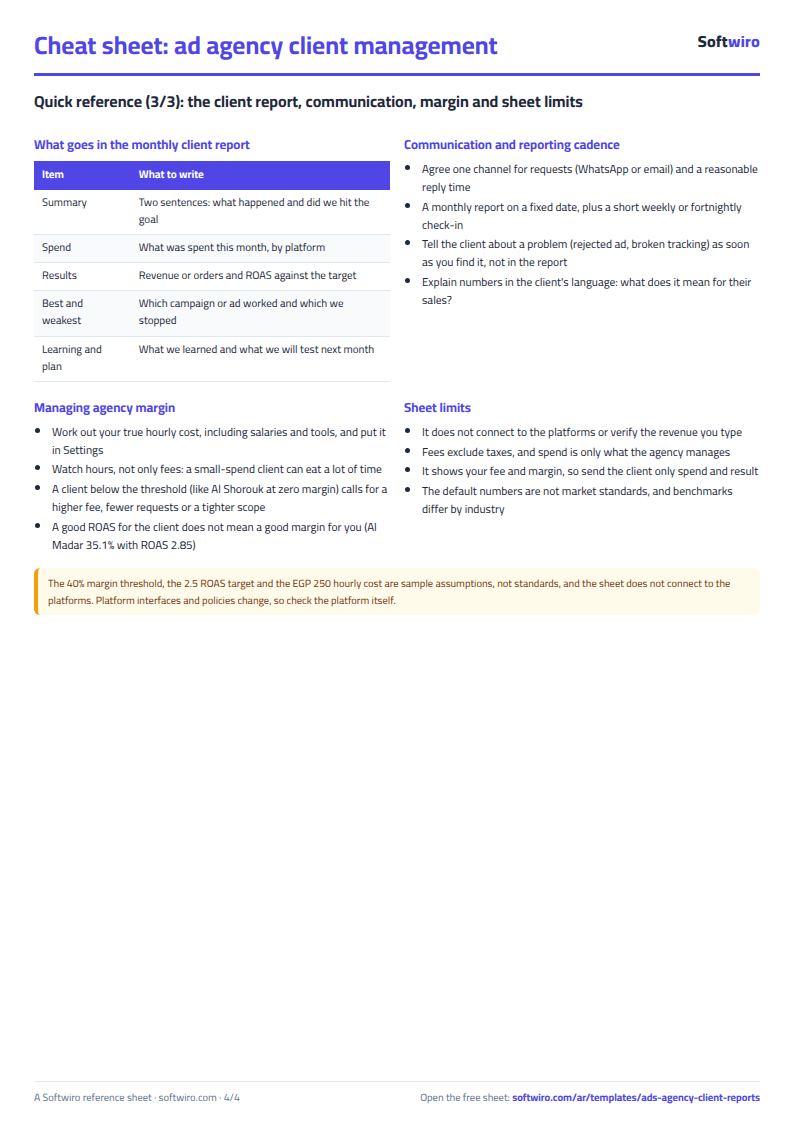
- A clear monthly report: what was spent, what was achieved against the agreed goal, what you learned and the plan for next month. A report explains the numbers; it does not just show them.
- Numbers we did not set: benchmarks differ by industry and market, so the sheet promises no particular margin or ROAS.
Limits and tips
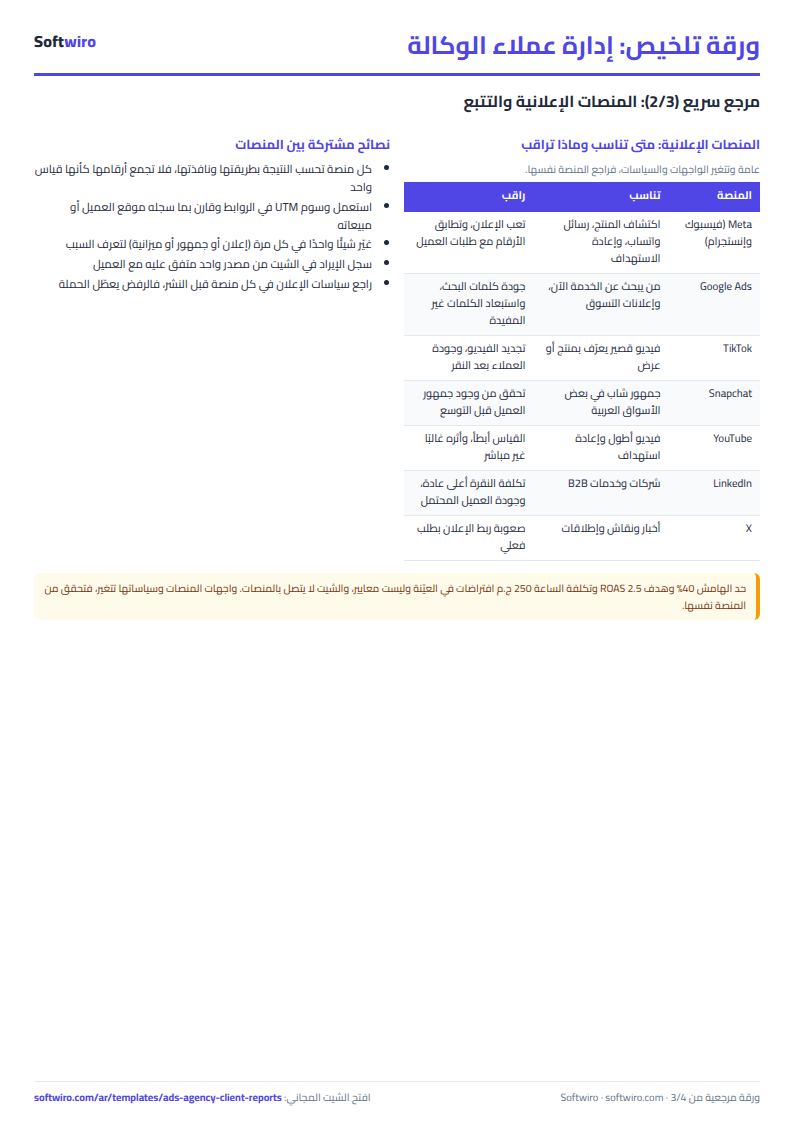
- The sheet does not connect to the platforms and does not verify the revenue you type. Enter figures from the platform reports or from the client, and check the source before delivering.
- The 40% margin threshold, the 2.5 ROAS target and the EGP 250 hourly cost are assumptions in the example, not standards. Use what fits your agency and contracts.
- Fees exclude taxes, and the spend counted is only what the agency manages.
- The report shows your fee and margin, so do not send the whole file to the client; send only spend, result and ROAS.
- Pick the client and platform from the lists and do not delete a row from the middle of the lists. The sheet holds 300 rows, 15 clients and 6 cards.
- The sheet sends no alerts, does not show a report to the client and does not refresh its numbers by itself.
Try it
Open the sheet and try it online, or download it for Excel. If you want an app with client-ready reports and a direct connection to the ad accounts, ask for it here.