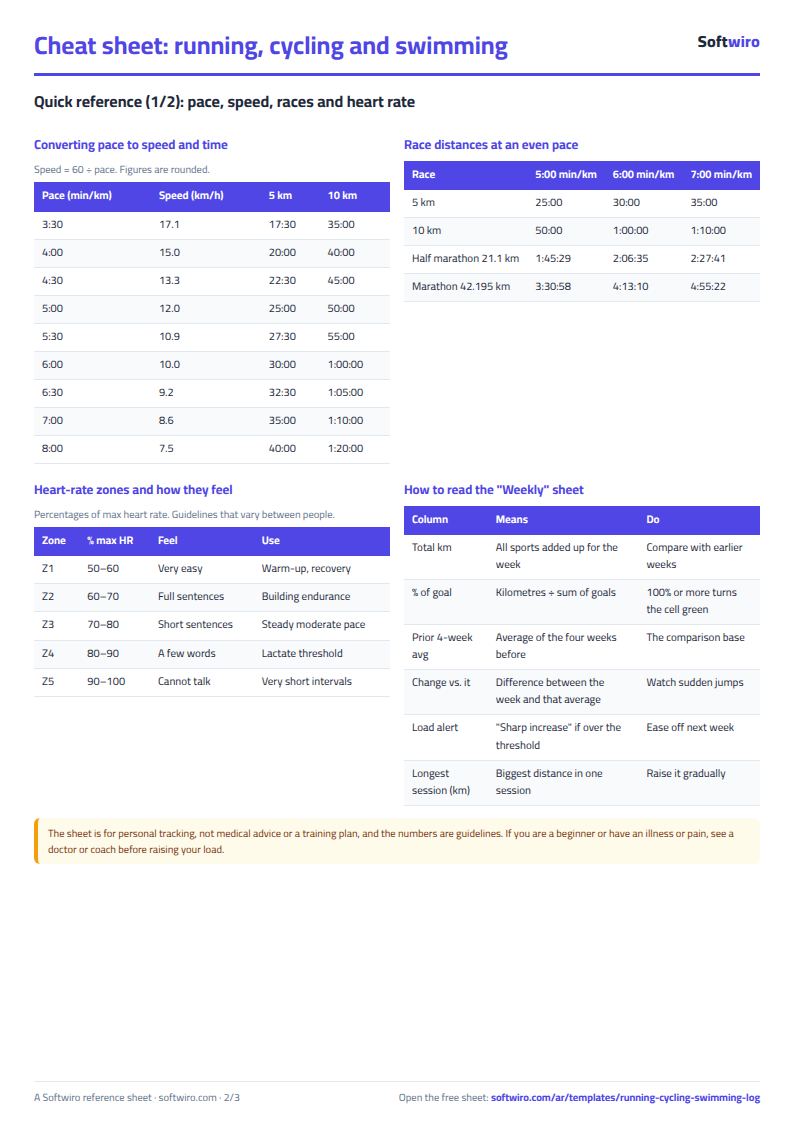
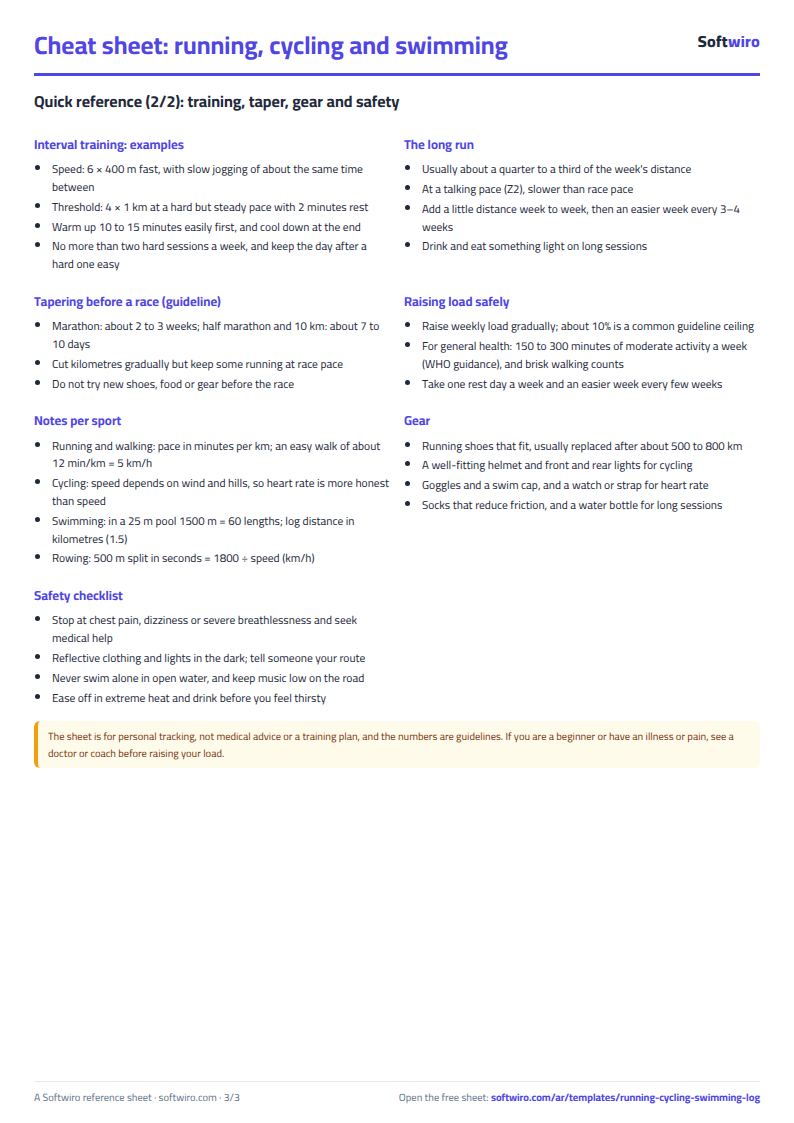
Whoever runs, rides and swims in the same week usually keeps the numbers in three different apps, and none of them says whether this week was too much. The free running, cycling and swimming log keeps every session in one file: it works out your pace, speed and time per 100 m, adds up each week, and warns you when the load jumps.
The problem it solves
Most injuries from a sudden jump in training do not announce themselves in advance. If you only look at one session you do not see that this week was almost double the weeks before it. Here every session goes into one list, and a weekly page compares each week with the average of the four weeks before it.
Steps
- Settings: your name, today's date (or =TODAY() so it updates by itself), the increase that triggers the warning (10% to start) and a weekly goal in km for each sport.
- Sessions: one row per session: date, sport from the list, distance in km, duration in minutes, and average heart rate if your watch records it.
- Leave the grey columns alone: pace in minutes per km for running and walking, speed for cycling and rowing, and time per 100 m for swimming.
- Open Weekly to see the last 10 weeks (Saturday to Friday) and watch the "load warning" column.
Worked example (sample data, 13 November 2026)
The figures are sample data for a made-up athlete, not real training. The sheet holds 37 sessions over 10 weeks:
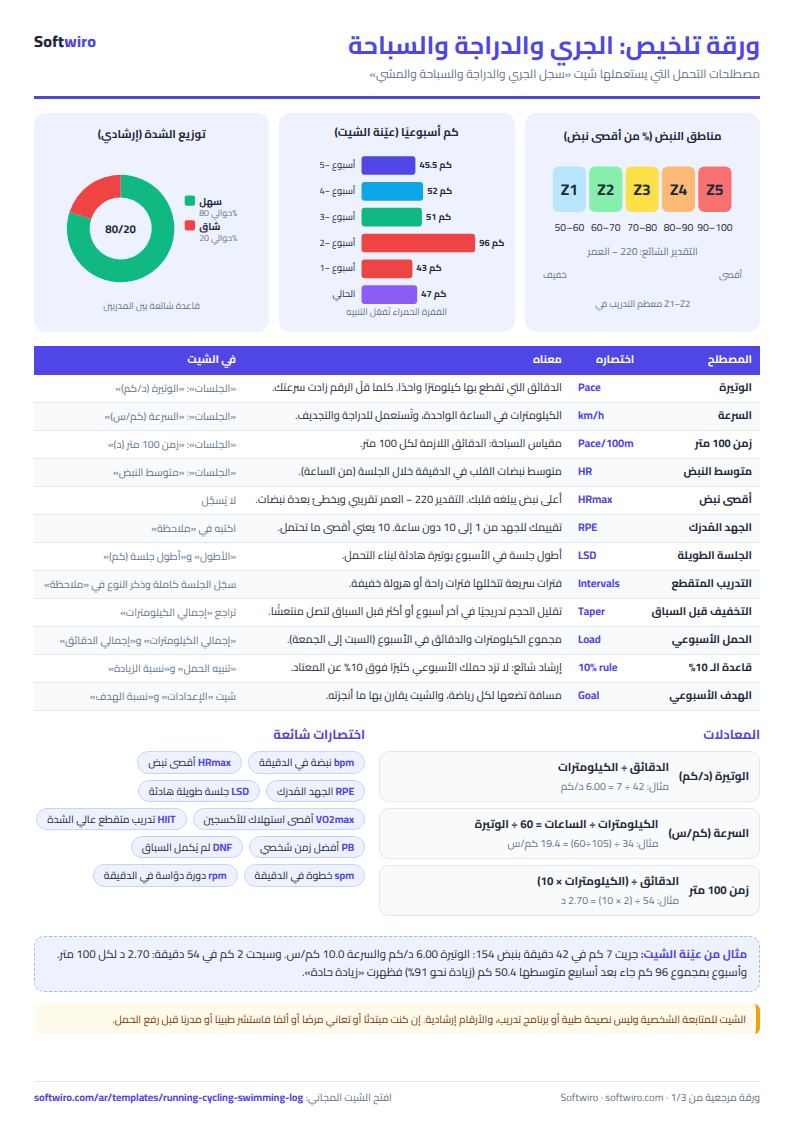
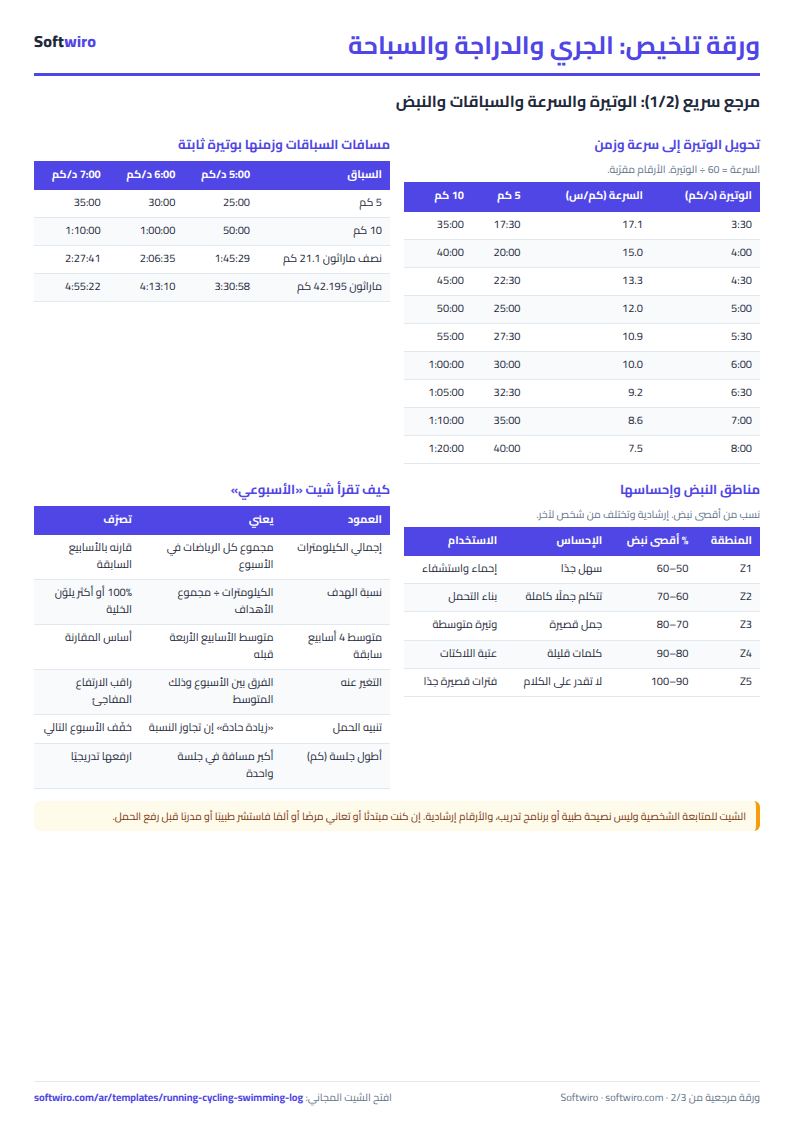
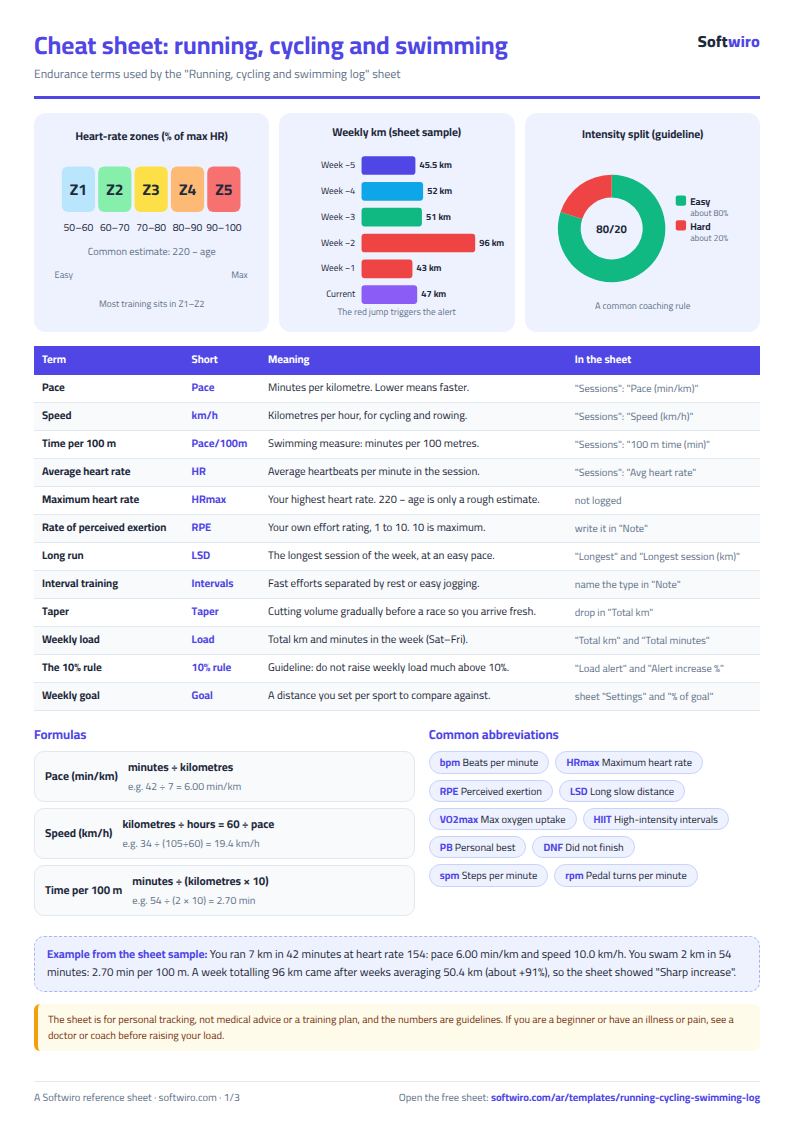
- A run: 7 km in 42 minutes gives a pace of 6.00 min/km (10.0 km/h).
- A ride: 34 km in 105 minutes gives 19.4 km/h.
- A swim: 2 km in 54 minutes gives 2.70 minutes per 100 m.
- A walk: 4 km in 48 minutes gives 12.00 min/km (5.0 km/h).
- The current week (from Saturday 7 November): 4 sessions, 47 km and 249 minutes. Against a weekly goal of 108 km (the sum of the goals of the five sports) that is 43.5%.
- The week of 24 October: 5 sessions, 96 km and 427 minutes, with a 45 km ride as the longest. The average of the four weeks before it is 50.4 km, so this week is 91% above it and is flagged "sharp increase", at 89% of the goal.
- Over the last 10 weeks: 523.5 km in 37 sessions, and 5 weeks were flagged.
How the numbers are worked out
- Pace = minutes ÷ kilometres. Speed = kilometres ÷ hours. Time per 100 m = minutes ÷ (kilometres × 10).
- Goal percentage = the week's kilometres across all sports ÷ the sum of your weekly goals.
- Warning: the week's kilometres compared with the average of the four weeks before it. If it is more than the average × (1 + the percentage in Settings), "sharp increase" appears. With no earlier weeks recorded, no warning appears.
Limits and tips
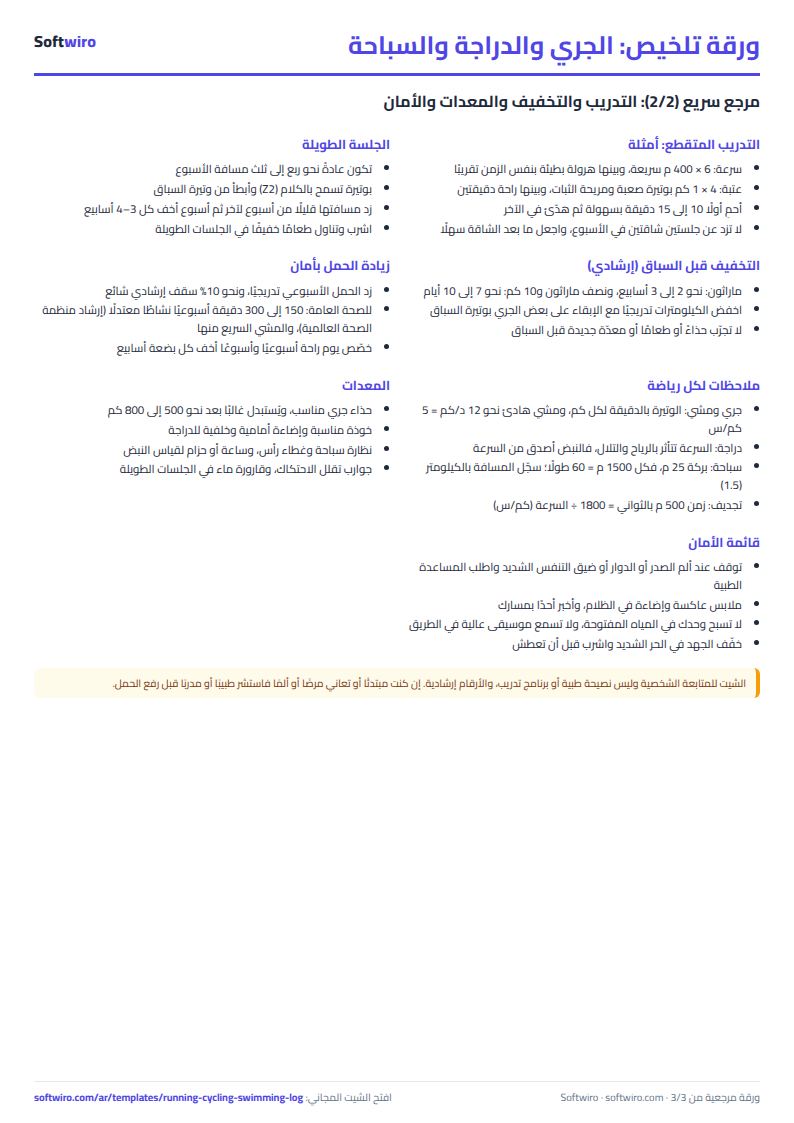
- The sheet is for personal tracking. It is not a training programme and not medical advice; a gradual increase does not replace asking a doctor or a coach if you feel pain.
- The warning compares kilometres only. It does not know the intensity of a session, your sleep or your recovery, and distances in different sports are added together as kilometres, which is a rough measure.
- A week starts on Saturday, and heart rate is optional: leave it empty if your watch does not measure it.
- Do not delete a row from the middle of the list. It holds 1500 sessions and five sports.
Try it
Open the sheet and try it online, or download it for Excel. If you want an app that connects to your watch and warns you on your phone, ask for it here.